Graphing Logarithmic Functions
Purplemath
Logarithms are the undoing of exponentials. For instance, because 34 = 81, then log3(81) = 4.
But finding points for graphs of logarithmic functions can be a bit time-consuming, because of the backwards, undo-ing nature of the logs.
Content Continues Below
This does not mean, however, that graphing logs is "hard"; it's just that it takes a little extra care.
By nature of the logarithm, most log graphs tend to have the same shape, looking (at first glance) similar to square-root graphs:
Here is the graph of :
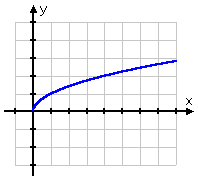
Since we cannot graph the square roots of negative numbers, the square-root function goes no further left than x = 0. The square root of zero is of course zero, so the square-root graph starts at the point (x, y) = (0, 0). Then it curves off to the right, growing sideways faster than it grows upward.
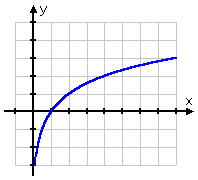
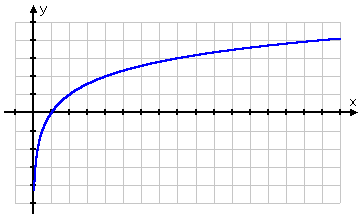
Here is the graph of y = log2(x):
Affiliate
Advertisement
Unlike the square-root graph, the graph of the log passes through the point (1, 0). From this point, the graph goes off to the right in a manner similar to that of the square-root function, expanding sideways faster than it grows upward.
However, to the left of the point (1, 0), the graph of the log function is quite different. Rather than just ending at the point (1, 0), the graph crosses the horizontal axis and slides down the positive side of the y-axis.
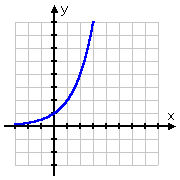
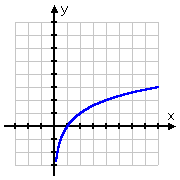
Remembering that logs are the inverses of exponentials, this shape for the log graph makes perfect sense: the graph of the log, being the inverse of the exponential, would just be the "flip" of the graph of the exponential:
The exponential function with a base of 2: y = 2x
The logarithmic function with a base of 2: y = log2(x)
And here are both functions, including the inversion line y = x in red:
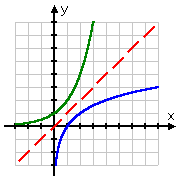
As the above images highlight, exponential graphs scurry along the horizontal axis, barely above the x-axis until it crosses the vertical axis (that is, the y-axis), typically at the point (0, 1), at which point the graph very quickly grows, zooming upward much faster than it moves sideways.
Logarithmic graphs, being the inverse of exponential graphs (that is, being the result of being flipped around the line y = x), behave backwards from this. They scurry *up* the vertical axis, barely to the right of that axis until it crosses the horizontal axis, typically at the point (1, 0), at which point the graph very slowly grows, zooming sideways faster than it moves upward.
Content Continues Below
It is fairly simple to graph exponentials. For instance, to graph y = 2x, you would just plug in some values for x, compute the corresponding y-values, and plot the points. Of course, the y-values grow really quickly, so you tend to have a tall graph, and you quit plotting points in short order.
But how do you graph logs? There are two options. Here is the first:
How do you graph a logarithmic function, step-by-step?
To graph a log function:
- Always keep in mind that logs are inverses of exponentials; this will remind you of the shape you should expect the graph to have.
- Pick input values (that is, x-values) that are powers of the base; for instance, if the log's base is 5, then pick x-values like 52 and 5−1.
- List the corresponding y-values; for instance, log5(52) = 2 = y and log5(5−1) = −1 = y
- Plot the points, taking care not to have the graph cross the vertical asymptote.
- Sketch in the line for the graph.
Here's how the process looks in use:
- Graph y = log2(x).
Affiliate
In order to graph this by using my understanding (rather than by reading stuff off a calculator screen), I need first to remember that logs are not defined for negative x or for x = 0. Because of this restriction on the domain (that is, on the input values) of the log, I won't even bother trying to find y-values for, say, x = −3 or x = 0. In fact, the vertical line x = 0 is actually the vertical asymptote, which I can never touch, let alone cross.
Instead, I'll start with x = 1, and work from there, using the definition of the log.
- Since 20 = 1, then log2(1) = 0, and (1, 0) is on the graph.
- Since 21 = 2, then log2(2) = 1, and (2, 1) is on the graph.
- Since 3 is not a power of 2, then log2(3) will be some messy value. So I won't bother with trying to find the value for x = 3.
- Since 22 = 4, then log2(4) = 2, and (4, 2) is on the graph.
- Since 5, 6, and 7 aren't powers of 2 either, I'll skip them and move up to x = 8.
- Since 23 = 8, then log2(8) = 3, so (8, 3) is on the graph.
- The next power of 2 is 16: since 24 = 16, then log2(16) = 4, and (16, 4) is on the graph.
- The next power of 2, being x = 32, is too big for my taste; I don't feel like drawing my graph that wide, so I'll quit at x = 16.
The above gives me the point (1, 0) and some points to the right, but what do I do for x-values between 0 and 1?
For this interval, I need to think in terms of negative powers and reciprocals. Just as the left-hand half of an exponential function has few graphable points (because the rest of them are simply too close to the x-axis to be distinguishable), so also the bottom half of the log function has few graphable points, the rest of them being too close to the y-axis to be distinguishable. But I can find a few plottable points:
- Since 2−1 = ½ = 0.5, then log2(0.5) = −1, and (0.5, −1) is on the graph.
- Since 2−2 = ¼ = 0.25, then log2(0.25) = −2, and (0.25, −2) is on the graph.
- Since 2−3 = 1/8 = 0.125, then log2(0.125) = −3, and (0.125, −3) is on the graph.
- The next power of 2 (as x slowly creeps leftward) is 1/16 = 2−4, but the x-value for the point (0.0625, −4) seems too small to bother with (it's too close to the y-axis to be distinguishable), so I'll quit with the points I've already found.
Listing these points gives me my T-chart:
Drawing my dots and then sketching in the line (remembering not to go to the left of the y-axis!), I get this graph:
Stay aware of, and comfortable with, how the powers work, and graphing logs shouldn't cause you too much trouble.
URL: https://www.purplemath.com/modules/graphlog.htm
Select a Course Below
Standardized Test Prep
Homeschool Math
© 2024 Purplemath, Inc. All right reserved. Web Design by ![]()


