Another Example of Graphing Logs
Purplemath
Most of the differences between the various log graphs you'll be doing will be due to the specifics of the base (is it 10? is it 2?) and various shifts of the graph from the standard position.
Yes, you'll be working with function transformations and translations again.
Content Continues Below
- Graph y = log2(x + 3).
This graph will be similar to the graph of log2(x) but, because the 3 that is added inside the function, its graph will be shifted three units sideways.
Affiliate
Since the +3 is inside the log's argument, the graph's shift cannot be up or down. This means that the shift has to be to the left or to the right. But which way?
Advertisement
You can keep track of the direction of the shift by looking at the basic graph's point (1, 0) (which I'm calling "basic" because it's both standard and also easy to remember). The log will be 0 when the argument, x + 3, is equal to 1. When is x + 3 equal to 1? When x = −2. Then the basic log-graph point of (1, 0) will be shifted over to(−2, 0) on this graph; that is, the graph is shifted three units to the left.
(If you are not comfortable with this concept or these manipulations, please review how to work with translations of functions directly from the rules.)
Since a log cannot have an argument of zero or less, then I must have x + 3 > 0. This tells me that, for this graph, x must always be greater than −3.
The graph of the basic log function y = log2(x) crawls up the positive side of the y-axis to reach the x-axis, with the line never going to the left of the limitation that x must be greater than zero. To remind myself of the similar limitation of this log (where x must always be greater than −3), I will insert a dashed line at x = −3:
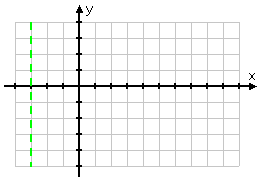
A line like this, which marks off territory where the graph can't go, is called a vertical asymptote, or simply an asymptote. I don't have to add this to the graph, but it can be very helpful, and might convince the grader that I do indeed know what I'm doing.
After I dash in the asymptote, I plot some points:
- 20 = 1, so log2(1) = 0; x + 3 = 1 for x = −2, so (−2, 0) is a point on the graph
- 21 = 2, so log2(2) = 1; x + 3 = 2 for x = −1, so (−1, 1) is a point on the graph
- 22 = 4, so log2(4) = 2; x + 3 = 4 for x = 1, so (1, 2) is a point on the graph
- 23 = 8, so log2(8) = 3; x + 3 = 8 for x = 5, so (5, 3) is a point on the graph
Then, working in the other direction:
- 2−1 = 0.5, so log2(0.5) = −1; x + 3 = 0.5 for x = −2.5, so (−2.5, −1) is a point on the graph
- 2−2 = 0.25, so log2(0.25) = −2; x + 3 = 0.25 for x = −2.75, so (−2.75, −2) is a point on the graph
- 2−3 = 0.125, so log2(0.125) = −3; x + 3 = 0.125 for x = −2.875, so (−2.875, −3) is a point on the graph
Note that, to find each of these points, I did not start with an x-value and then puzzle my way to a y-value; that would be too hard, and I'm too lazy. Instead, I started with a simple exponential statement, switched it around to the corresponding logarithmic statement, and then figured out, for that exponent (which is also my y-value), what the x-value needed to be. This method is, in my view, much the simpler way to work these problems.
Plotting the points I've calculated, I get:
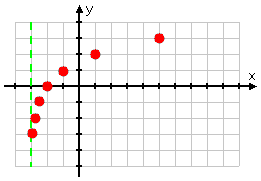
...and connecting the dots gives me the following graph:
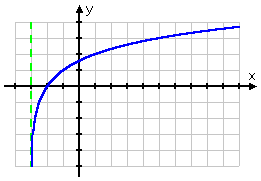
Content Continues Below
If you check this in your calculator, first, remember to put the x + 3 inside parentheses, or your calculator will think you mean log2(x) + 3, and you'll get the wrong answer. Second, remember that your calculator can only follow its programming — it can't think — so the graph it displays will likely be at least partially incorrect, even if you enter the function correctly.
For example, if you plug y = log2(x + 3) into a graphing calculator — in the change-of-base formulation of — you will likely get a graph that looks something like this:
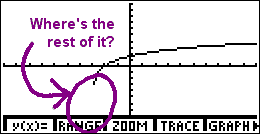
Now, you know full well that the log doesn't just stop there at the left, hanging uselessly in space. Why is the calculator doing it wrong?
Because it's just a machine, and it's doing the best it can.
Affiliate
The calculator graphs in a manner similar to how you do: it picks x-values, computes corresponding y-values, plots the points, and connects the dots. But, whereas you know that the log graph continues downward forever, getting infinitesimally close to the y-axis (or wherever else the vertical asymptote happens to be), the calculator only knows that it tried one x-value on its list, got "error" for an answer, tried the next x-value on its list, and got a valid y-value. Since it has no other dots before that first one, and because it can't think, it starts the graph with that first dot.
This is another instance of "student smart; calculator stupid". Don't assume, just because the calculator displays a graph a certain way, that this is what the graph actually looks like. Use your head!
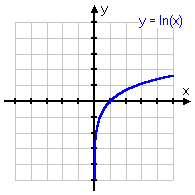
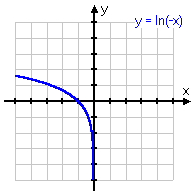
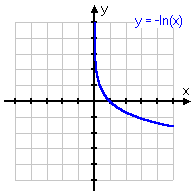
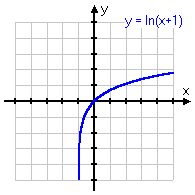
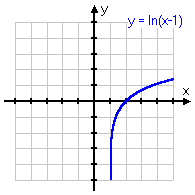
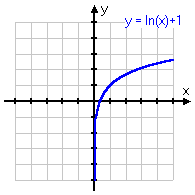
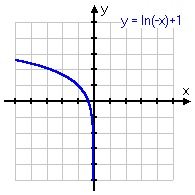
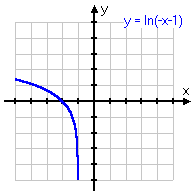
Below are some different variations on the same basic logarithmic function, with the associated graph below each equation. Note that, even if the graph is moved left or right, or up or down, or is flipped upside-down, it still displays the same curve.
(A widget for graphing logarithmic functions, and for checking your own graphs, is available below the graphs.)
y = ln(x)
y = ln(−x)
y = −ln(x)
y = ln(x + 1)
y = ln(−x + 1)
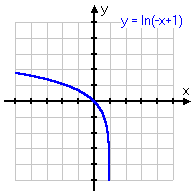
y = −ln(−x)
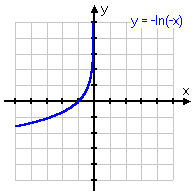
y = ln(x) − 1
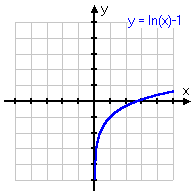
y = ln(−x) − 1
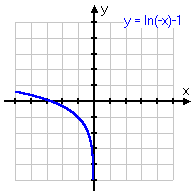
y = ln(x − 1)
y = ln(x) + 1
y = ln(−x) + 1
y = ln(−x − 1)
URL: https://www.purplemath.com/modules/graphlog3.htm
You can use the Mathway widget below to practice graphing logs. Try the entered exercise, or type in your own exercise. Then click the button and select "Graph" to compare your answer to Mathway's.
Please accept "preferences" cookies in order to enable this widget.
(Click "Tap to view steps" to be taken directly to the Mathway site for a paid upgrade.)
Select a Course Below
Standardized Test Prep
Homeschool Math
© 2024 Purplemath, Inc. All right reserved. Web Design by ![]()


