Graphing Radical (Square-Root) Functions
Purplemath
Graphing radical functions is probably the first time you'll have encountered the need to consider the domain of the function before you do the graph. This is because you cannot put a "minus" value inside a square root.
In addition to keeping track of the domain, you will also need to graph very neatly, or you could easily get most of your graphs at least partially wrong.
Content Continues Below
Since "graphing radical functions" usually means "graphing functions involving square roots", most of the examples in this lesson will deal with square roots.
What is the basic square-root graph?
The basic square-root function is , and its graph looks like this:
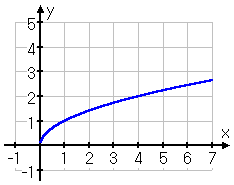
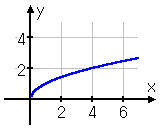
Since there can't be a negative inside the radical, then the domain is x ≥ 0. The graph begins at (0, 0) and then heads to the right, growing slowly upward and x speeds rightward. Nearly all square-root functions' graphs will be some version of the above.
-
Graph
First off, I need to check the domain of this function, so I know where not to try to plot points. I know that I can't graph a negative inside a square root, so I need to nail down what x-values are going to be okay. I know, for instance, that x is not allowed to be 5, because:
To find the domain of this function, I take whatever is inside the square root (that is, I take the "argument" of the radical), and I set it "equal to or greater than zero". Then I solve this inequality for the allowable values of x (that is, I solve for the domain):
3 − x ≥ 0
3 ≥ x
x ≤ 3
Affiliate
Advertisement
(The last line above isn't required, but I find it easier to work with the variable on the left-hand side of the inequality. You do whatever works best for you.)
Now I know that I shouldn't pick any x-value that is greater than 3 for my table of values (often called a "T-chart"). And I also should not try to draw anything on my graph to the right of x = 3: if I can't have any x-values past 3, then I can't very well have the graphed line go to the right of x = 3.
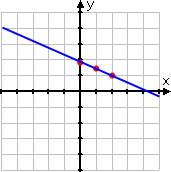
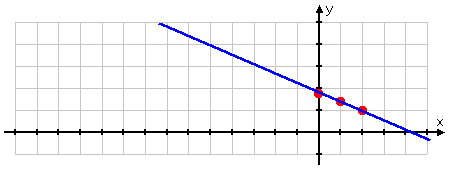
The following is what many beginning students mistakenly do: They pick only two or three x-values, and they pick them very close together:
They then plot only these few points:
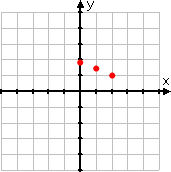
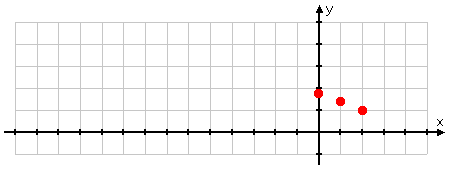
...and then they draw a straight line through those points:
WRONG GRAPH!
Content Continues Below
In contrast to the above, I'm going to take the time to respect the domain of the function. I'll also take the time to pick not only more x-values, but also more-useful x-values that will give me nice neat points for plotting. I'll also be sure to include the end-point of the graphed line, being the boundary point given by the "x ≤ 3" domain.
Putting this all together, my T-chart ends up looking like this:
Then, using my ruler to create nice axes and scales, I plot these values precisely:

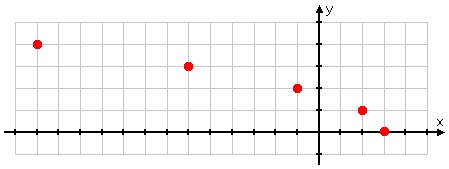
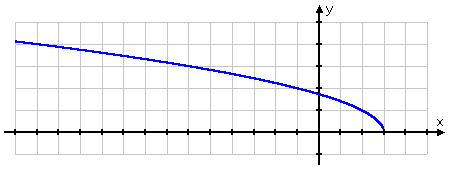
...and then I draw a curved line through these points, remembering not to extend the line to the right of x = 3:
Correct graph

Affiliate
How do you graph square-root functions?
In sum, the steps for graphing radical (that is, square root) functions are these:
- Find the domain of the function: set the insides of the radical "greater than or equal to" zero, and solve for the allowable x-values.
- Make a T-chart to hold your plot points.
- Pick x-values within the domain (including the "or equal to" endpoint of the domain), and simplify to get the corresponding y-values. (It can be helpful to find x-values that will give you a perfect square inside the radical; these will be the nicest points to plot.)
- Make a neat axis system (yes, using a ruler to make straight lines and to mark of consistent scales).
- Plot your points on the axis system.
- Draw a curved line through the points, and remember to mark clearly the endpoint (or start point, depending on your perspective) so that it's clear to the grader that you know what you're doing.
How do you draw a radical graph?
When drawing a radical graph, keep the following in mind:
- You should expect radical functions to graph as curved lines. Do not try to put a straight line through the points that you've plotted.
- You should also expect radical graphs to be much wider (that is, stretched out, side-to-side) than they are tall. Be sure to use adequate space on your paper for a good graph.
You saw, in the above example, how I was careful to pick x-values for my T-chart that gave nice neat y-values. This is not required, nor is this even always reasonably feasible. But it can make graphing much simpler so it can be worth the time to be sure of your plot points, especially if you've got a graphing calculator that can do a table of values for you.
URL: https://www.purplemath.com/modules/graphrad.htm
You can use the Mathway widget below to practice graphing basic square-root functions. Try the entered exercise, or type in your own exercise. Then click the button and select "Graph" — or "Graph From a Table of Values", if you'd also like to see a T-chart — to compare your answer to Mathway's. (Ignore T-chart points that contain the number i in them; they're not graphable in this context.)
Please accept "preferences" cookies in order to enable this widget.
(Click "Tap to view steps" to be taken directly to the Mathway site for a paid upgrade.)
Select a Course Below
Standardized Test Prep
Homeschool Math
© 2024 Purplemath, Inc. All right reserved. Web Design by ![]()


