Graphing Logs with a Calculator
Purplemath
In the previous example, I said there were two options for how to graph logs. The previous page demonstrated how to work from the concept of logarithms to find nice neat points to plot, without using a calculator.
The other option is, obviously, that you do use your calculator to find plot points.
Content Continues Below
How do you graph log functions with a calculator?
To graph a logarithmic function with a graphing calculator, such as the TI-84, follow these steps:
- Always keep in mind that logs are inverses of exponentials; if you remind yourself of the expected shape of the graph, you'll better be able to see if an error was made in entering the function into your calculator.
- If the base of the log is something other than e or 10 (that is, if the log is something other than the natural log or the common log), then apply the change-of-base formula to convert the log expression into something your calculator will understand. For instance, if you are given y = log3(x), use the formula to convert the function expression to .
- Set the calculator's minimum for the x-values to be zero or, if your calculator's table utility is twitchy, to some value slightly greater than zero. (For instance, in my old TI-85, I have to set the minimum input value to be something like x = ½ to avoid the calculator freezing or crashing.)
- Copy down the x-values and the corresponding y-values.
- Plot the points as best you can, using one or two decimal places of accuracy.
- Sketch in the line for the graph, taking care not to have the graph cross the vertical asymptote.
Affiliate
Note: If you're dealing with the natural log (that is, the base e log), then you'll be forced to use your calculator and its ln button, because the base e is not a nice, neat whole number. You'll be stuck with decimals, no matter what you do.
- Graph y = log2(x)
To find my plot-points using my calculator (since my calculator can only compute common base-10 logs and natural base-e logs), I will need to use the change-of-base formula to convert the given log function into a function statement that means the same thing mathematically, but is also a form that my calculator can understand.
The original statement, y = log2(x), becomes :

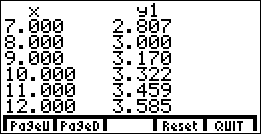
Once I've entered the calculator-friendly form of the equation, I can get some plot points from my calculator's table utility:


Advertisement
(If you have an old TI-85 like I do, so you have no in-built table utility, you can install any of the various after-market programs which do much the same thing. The graphics above are screen shots of what the table program on my TI-85 produced.)
I know I have to have all positive x-values inside the log, so I start the TABLE listing at x = 1, and go from there.
I'd still like to have some plot points between zero and one, so I adjust the initial value (that is, the start value) and the increment (that is, the count-by amount) to get some additional plot points between x = 0 and x = 1:

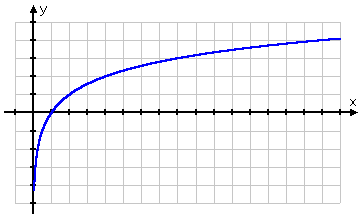
Using these points (plotted to one or two decimal places), I end up with the same graph as before.

Content Continues Below
Depending upon your calculator's software, you will either get blank spaces in your table for the y-values when x = 0 and when x is negative; or the slots for those y-values will display "error", "undefined", or some other error code; or else the program will crash. (My TI-85 crashes for undefined y-values, which is why I was careful to start my TABLE display above at a positive x-value.)
This behavior in the table feature reinforces the fact that logarithms are not defined for non-positive arguments.
(Regarding finding plot points between x = 0 and x = 1, if you do not know how to change your initial table value from x = 0 or how to change your increment from 1, consult your owner's manual; the instructions will be somewhere in the chapter on graphing.)
Affiliate
If you are graphing a common log (that is, the base-10 log) or a natural log (that is, the base-e log), just use your calculator to get the (approximate) plot points. All scientific and graphing calculators have dedicated buttons for these log bases.
When working with the common log, you will quickly reach awkwardly large numbers if you try to plot only whole-number points; for instance, in order to get as high as y = 2, you'd have to use x = 100, and your graph will be ridiculously wide (unless you change the horizontal scale, probably to a log scale).
When working with the natural log, the natural base e is an irrational number anyway, so there's no point in even trying to find nice neat plot points, because, other than the point (1, 0), there simply aren't any nice neat ones.
Sometimes the log graph is shifted a bit from the usual location (shown in the graph above); the graph can be shifted either up, down, right, left, or upside-down, or else some combination of these. But the general shape of the graph tends to remain the same.
- Graph y = log3(x) + 2.
This is the basic log graph, but it's been shifted upward by two units. To find plot points for this graph, I will plug in useful values of x (being powers of 3, because of the base of the log) and then I'll simplify for the corresponding values of y.
- 30 = 1, so log3(1) = 0, log3(1) + 2 = 2, and (1, 2) is a point on the graph
- 31 = 3, so log3(3) = 1, log3(3) + 2 = 3, and (3, 3) is a point on the graph
- 32 = 9, so log3(9) = 2, log3(9) + 2 = 4, and (9, 4) is a point on the graph
- 33 = 27, so log3(27) = 3, log3(27) + 2 = 5, and (27, 5) is a point on the graph
Moving in the other direction (to get some y-values for x between 0 and 1):
- , so , , and is a point on the graph
- , so , , and is a point on the graph
- , so , , and is a point on the graph
These are the only nice and neat points that I'm going to bother finding for my graph. If I feel a need for additional plot points, especially between any two of the points I found above, I can evaluate the function ln(x) / ln(3) in my calculator.
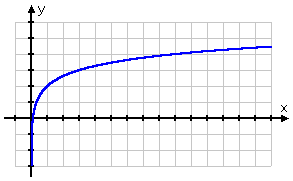
The graph of y = log3(x) + 2 looks like this:

Note that this graph has the same shape as the previous graph; it's just been shifted two units upward.
URL: https://www.purplemath.com/modules/graphlog2.htm
Select a Course Below
Standardized Test Prep
Homeschool Math
© 2024 Purplemath, Inc. All right reserved. Web Design by ![]()


