Graphing Absolute Values & Quadratics
Purplemath
Obviously, straight lines are going to be the easiest things to draw. But most of the time you'll be doing graphing for equations what are at least a bit more complicated. The first step up comes with absolute-value graphs, which consist (at least when you're starting out) of two straight lines that form a sort of "V", either right-side-up or upside-down.
Content Continues Below
(If you're not familiar with how to work with absolute-value expressions, please divert here first.)
Absolute Values
Advertisement
Absolute-value graphs are a good example of a context in which we need to be careful to remember to pick negative x-values for our T-chart. Otherwise, it is very easy to forget that an absolute value graph is not going to be just a single, unbroken straight line.
For instance, suppose we are given the equation y = | x |. And suppose we only chose positive x-values, so our T-chart looks like this:

Affiliate
Then our points look like this:

And we'd connect our dots like this:

We just flunked the quiz.
Instead, let's spread out our x-values a bit, and let's remember this time to plot a negative x-value or two. Our new T-chart looks like this:

Then our points look like this:

Because our dots are nicely spread out, and because we remembered to include a couple of "minus" x-values, we remember that absolute-value equations graph as broken lines, so we apply our ruler twice to get:

And this is the correct graph!
(If you would like to study this topic in greater detail, please see Graphing Absolute-Value Functions.)
Content Continues Below
Quadratics
When graphing quadratic equations / functions, we need to plot more than just three points; I would suggest a minimum of at least five points, but seven to nine points will be better if you're just starting out. And we should expect to need to plot negative x-values, too. Three points just won't cut it anymore, because quadratics graph as curvy lines called "parabolas".
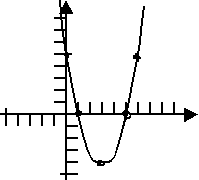
For instance, suppose they give us y = x2 − 6x + 5. There are any number of things we can do to help ourselves graph this correctly. We can start by finding the x- and y-intercepts. (For more info, please see Intercepts.) In this case, the intercepts are at (1, 0), (5, 0), and (0, 5).
Affiliate
In addition, we can find the vertex of the parabola, which is the highest or lowest spot on the graph. (For more info, please see Vertex.) In this case, the vertex is the lowest point on the graph, and that point is at (3, −4).
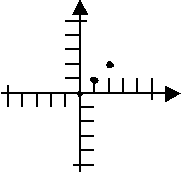
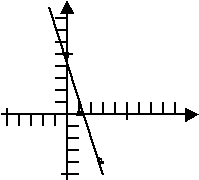
But mostly we need to take the time to plot quite a few points, so that we can "see" the shape before we start sketching it in. Look at what often happens when a beginner plots only three points:
T-chart

Incorrect graph

But that graph above isn't right; this parabola should look sort of like a "smilie", not like a straight line. (And, if you look closely, the plotted points don't actually even line up as a straight line! The ruler put a line kind of "amongst" the dots, rather than "through" them.)
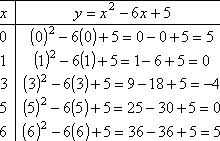
So we'll want to plot a few more points. We already found the intercepts and the vertex (above). Let's add one more point to that, using x = 6:
T-chart

Correct graph

Much better! This is a graph that'll get full points!
(Note: A postive quadratic can be thought of as graphing as a "smilie", and a negative quadratic can be thought of as graphing as a "frownie". Yeah, it's a dumb way of putting it, but you won't forget it now, will you? If you would like to study this topic in greater detail, please see Graphing Quadratic Functions.)
URL: https://www.purplemath.com/modules/graphing2.htm
Select a Course Below
Standardized Test Prep
Homeschool Math
© 2024 Purplemath, Inc. All right reserved. Web Design by ![]()


