Graphing Absolute-Value Functions: Straight Lines
Purplemath
Taking the absolute value of a negative number makes it positive. On the number line, taking the absolute value of a negative number flips the point from before zero to after it, and by the same amount. How would absolute values affect plotted points for a straight line (that is, for a point on a line y = mx + b)?
Content Continues Below
In the straight-line equation, the value of y is given by mx + b. If you take the absolute value of the |mx + b| part, you'll be taking the absolute value of the y-coordinate of the x,y-point. If the value of y is negative, then taking the absolute value will flip the point from below the x-axis to above it.
For this reason, graphs of absolute value functions tend not to look quite like the graphs of linear functions that you've already studied. And because of how absolute values behave, it is important to include inputs in your T-chart that give negative output values, when graphing absolute-value functions. If you do not pick x-values that will put negatives inside the absolute value, you will usually mislead yourself as to what the graph looks like.
For instance, suppose your class is taking the following quiz:
-
Graph y = | x + 2 |
One of the other students does what is commonly done: he picks only positive x-values for his T-chart:
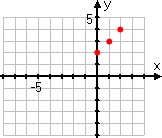
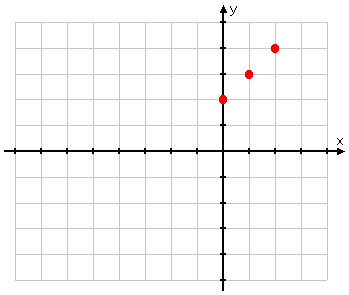
Then he plots his points:
Affiliate
These points are fine, as far as they go, but they aren't enough; they don't give an accurate idea of what the graph should look like. In particular, they don't include any "minus" inputs, so it's easy to forget that those absolute-value bars mean something. As a result, the student forgets to take account of those bars, and draws an erroneous graph:
WRONG ANSWER!
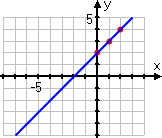
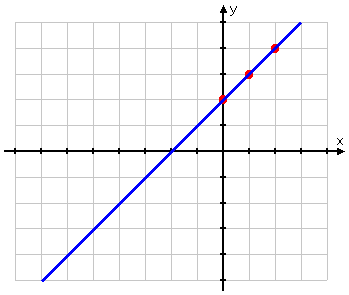
Aaaaaand... he just flunked the quiz.
Advertisement
But you're more careful. You remember that absolute-value graphs involve absolute values, and that absolute values affect "minus" inputs. So you pick x-values that put a "minus" inside the absolute value, and you choose quite a few more points. Your T-chart looks more like this:
Then you plot your points:
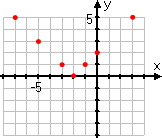
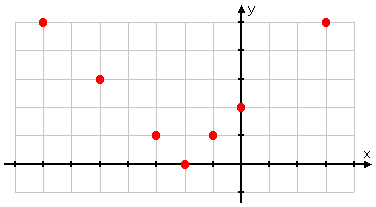
...and you finish up by connecting your dots:
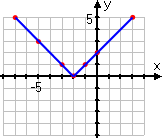
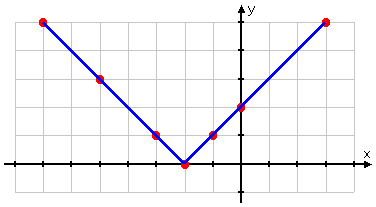
You have the correct graph:
Right answer!

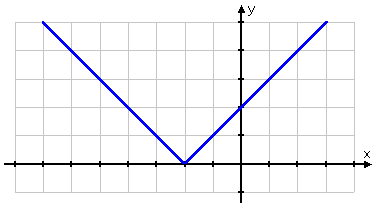
Aaaaand... you just aced the quiz. Good work!
What is the graphing pattern for absolute-value functions?
When graphing the absolute value of a straight-line equation (that is, when graphing y = |mx + b|), the graph's pattern will be that of a V, where the turning point (or elbow) of the V is on the x-axis. Of course, the function can be translated about the plane — for instance, y = 3|−2x + 5| − 1, which pulls the V down by one unit — but the pattern of the graph will always be a V.
Content Continues Below
How do you graph absolute values of straight lines?
To graph the absolute value of a straight line, follow these steps:
- Fill in a T-chart, making sure that you've used some x-values that make the insides of the absolute value negative.
- Plot the points from the T-chart (or at least the reasonable points).
- Connect the points, drawing straight lines for each half of the graph.
- Make sure that your result looks like a V, either right-side-up or upside-down.
In all cases, you should take care that you pick a good range of x-values, because a mere three x-values right next to each other will almost certainly not give you anywhere near enough information to draw a valid picture.
Conceptual note: The absolute-value bars make the entered values evaluate to being always non-negative (that is, to being positive or zero). As a result, the elbow of the V in the above graph occurred where the sign on the inside of the absolute-value bars was zero. When x was less than −2, the expression x + 2 was less than zero, and the absolute-value bars flipped those "minus" values from below the x-axis to above it. When x equalled −2, then the argument (that is, the expression inside the bars) equalled zero. For all x-values to the right of −2, the argument was positive, so the absolute-value bars didn't change anything.
In other words, graphically, the absolute-value bars took the left-hand side of the straight-line graph and flipped the "minus" part (in green on the graph below) from below the x-axis to above it.
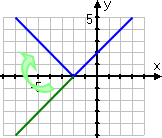

Noticing where the argument of the absolute-value bars will be zero can be helpful in ensuring that you're doing the graph correctly.
-
Graph y = | x | + 2
This function is almost the same as the previous one.
Affiliate
However, the argument of the previous absolute-value expression was x + 2. In this case, only the x is inside the absolute-value bars. This argument will be zero when x = 0, so I should expect to see an elbow in that area. Also, since the "plus two" is outside of the absolute-value bars, I expect my graph to look like the regular absolute-value graph (being a V with the elbow at the origin), but moved upward by two units.
First, I'll fill in my T-chart, making sure to pick some negative x-values as I go:
Then I'll draw my dots and fill in the graph:
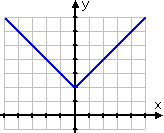
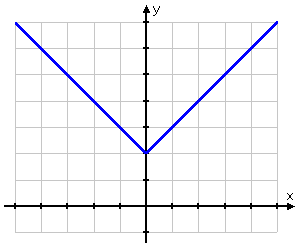
Because absolute-value bars always spit out non-negative values, it can be tempting to assume that absolute-value graphs can not go below the x-axis. But they can, and they will.
-
Graph y = −| x + 2 |
This function is kind of the opposite of the first function above, because there is a "minus" on the absolute-value expression on the right-hand side of the equation. Because of this "minus", the positive values provided by the absolute-value bars will all be switched to negative values.
In other words, I should expect this graph to have its elbow at (−2, 0) like the first graph above, but the rest of the graph will be flipped upside-down to be below the x-axis.
First, I'll fill in my T-chart:
Then I do my graph:

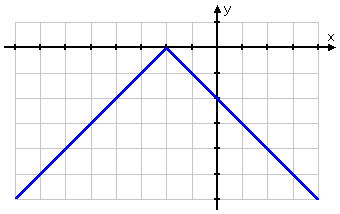
Also, don't assume that any absolute-value graph will be only ever on one side of the x-axis. The graphs can cross the axis:
-
Graph y = −| x | + 2
First, I do my T-chart:
And then I do my graph:

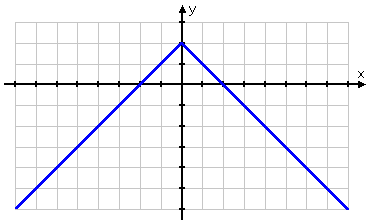
No matter what the original straight line, if the function takes the absolute value of the variable-containing part, then the graph will be some sort of V. It might be shifted off to the side, it might be really skinny or fat, it might be upside-down; but it'll always be a V.
URL: https://www.purplemath.com/modules/graphabs.htm
You can use the Mathway widget below to practice graphing absolute-value functions of straight lines. Try the entered exercise, or type in your own exercise. Then click the button and select "Graph" to compare your answer to Mathway's. (Or skip the widget and continue to the next page.)
Please accept "preferences" cookies in order to enable this widget.
(Click "Tap to view steps" to be taken directly to the Mathway site for a paid upgrade.)
Select a Course Below
Standardized Test Prep
Homeschool Math
© 2024 Purplemath, Inc. All right reserved. Web Design by ![]()


