Graphing Quadratics
Purplemath
The general technique for graphing quadratics is the same as for graphing linear equations; namely, you make a T-chart and plot some points.
However, since quadratics graph as curvy lines (called "parabolas"), rather than the straight lines generated by linear equations, there are some additional considerations involved in drawing accurate graphs for quadratics.
Content Continues Below
Advertisement
When you graphed straight lines, you only needed two points to graph your line, though you generally plotted three or more points just to be on the safe side.
Affiliate
However, three points will almost certainly not be enough points for graphing a quadratic, at least not until you are very experienced.
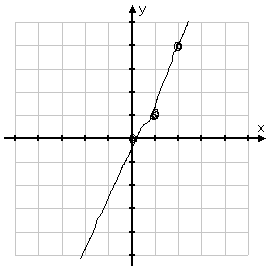
For example, the most basic quadratic is y = x2. Suppose a student, asked to graph this most-basic of quadratics, computes these three points:
Then, based only on his experience with linear graphs, he tries to put a straight line through the points.
Incorrect graph:

Don't do this!
He got the graph wrong. You, on the other hand, are more careful.
Content Continues Below
How do you graph a quadratic function (that is, a parabola) without a calculator?
To graph a quadratic function (whose shape is called a parabola), follow these steps:
- Make a T-chart.
- Pick at least five x-values (eight or ten would be better), and calculate their corresponding y-values.
- Use your ruler to draw a neat axis system, and label each axis with a consistent scale.
- Plot the points from your T-chart. (If your points don't show the curve changing direction and going back the way it came, then plot some more points.)
- Connect your plotted points with a curved line; don't try connecting the points with straight line segments.
Affiliate
Suppose you are given y = x2 to graph. You start by making a T-chart and finding many points:
That last point has a rather large y-value, so you decide that you won't bother drawing your graph large enough to plot it. (And this is perfectly okay! Not all computed points are equally useful for plotting. Use your good sense to pick and choose.)
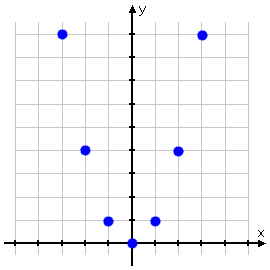
Leaving aside that one point, you plot all the other points:

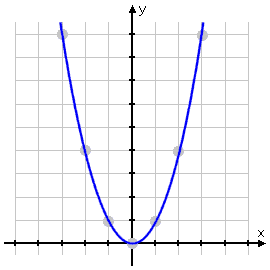
Even if you'd forgotten that quadratics graph as curvy parabolas, these plotted points will swiftly remind you of this fact. So you draw a nicely smooth curving line, passing neatly through the plotted points:
Correct graph of y = x2:

Unlike the careless student, you just got the graph right.
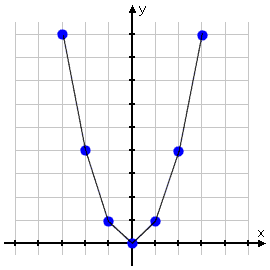
Some students will plot the points correctly, but will then connect the points with straight line segments, like this:
Incorrect "segment" graph:

Don't do this!
This is wrong! You do still need a ruler for doing your graphing, but only for drawing the axes, not for drawing the parabolas. Parabolas graph as smoothly curved lines, not as jointed segments. Take the time to draw it right.
How do you graph a quadratic function (that is, a parabola) with a calculator?
To graph a quadratic function with, say, a TI-84, you'll need to follow the instructions in your owner's manual for graphing. Using a TI-84, I would suggest the following:
- Hit the Y= button.
- Enter the quadratic expression after the "equals" sign on the screen.
- Hit 2nd and then graph, which takes you to table.
- Scroll through the table to get a good idea of which points would be useful to plot. Fill your T-chart with these points.
- Hit graph to see the graphed parabola.
- If the parabola does not fit nicely within the standard window, then hit window and change the settings to something that works better.
- Use your ruler to draw your axes and their scales.
- Plot the points from your T-chart, and connect them with curves to form the parabola.
What is the 1-3-5 method of graphing quadratics?
The 1-3-5 method of graphing parabolas uses the fact that, for the basic parabola (where the x2 has nothing multiplied on it), the "first" point is the vertex (in the basic function, the vertex is at (0, 0)). So this method assumes that you've already found the vertex of the parabola.
You would then move one unit to the right (to x = 1) and move one unit up (to y = 1) and plot that point, (1, 1). For the third point, you would move one more unit to the right, but three units up (so you'd be at the point (2, 4). For the fourth point, you would move one more unit to the right, but five units up (so you'd be at the point (3, 9).
You would mirror these points on the other side of the y-axis.
Note that this method works *only* under specific conditions; namely, the x2 term cannot be multiplied by anything, and the vertex is easy to find. Do not rely on this method for every parabolic graph. Many ("most"?) quadratic functions will require a bit more of you than the above formulation of 1-3-5.
URL: https://www.purplemath.com/modules/grphquad.htm
Select a Course Below
Standardized Test Prep
Homeschool Math
© 2024 Purplemath, Inc. All right reserved. Web Design by ![]()


