Graphing Rationals: The Case with the Hole
Purplemath
Why do some rational graphs have a hole?
If the numerator and denominator of a rational expression have a shared factor that cancels, then the graph of the rational function will have a hole in it. This situation is distinct from that of a graph having a gap due in it due to having a vertical asymptote.
Content Continues Below
A vertical asymptote will cause a graph to shoot up or down the asymptote's dashed line. On the other hand, if a factor that *would* have caused a vertical asymptote cancels off with a matching factor in the numerator, then the resulting graph (at least in that part of the graph) will be a regular polynomial line, but with a hole in it.
The hole indicates where a vertical asymptote *would* have been, had you not cancelled off the duplicate factor. The hole is drawn as being an open (that is, an unfilled) circle.
- Graph the following:
First I'll find any vertical asymptotes, by setting the denominator equal to zero and solving:
x − 2 = 0
x = 2
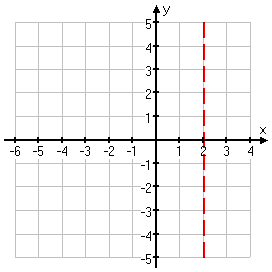
So I have a vertical asymptote at x = 2. I'll dash this in on my graph:
Affiliate
Advertisement
Looking at the degrees of the numerator and denominator, I see that the numerator is a quadratic while the denominator is linear. Since the degree is one greater in the numerator, I know that I will have a slant (or oblique) asymptote. But I need to do the long division to find out what the equation of that asymptote is going to be.
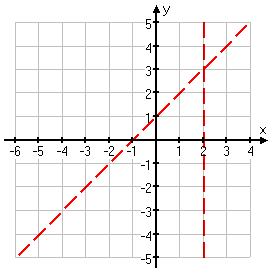
Hmm... The slant asymptote is clearly y = x + 1, but there is no remainder; the division came out evenly. Ah! That's because the numerator happens to factor as (x − 2)(x + 1), so the x − 2 factor divides out evenly and there is no remainder.
The slant (not horizontal) asymptote is at y = x + 1:
Now I'll find the intercepts:
y-asymptote (so x = 0):
x-asymptote (so y = 0):
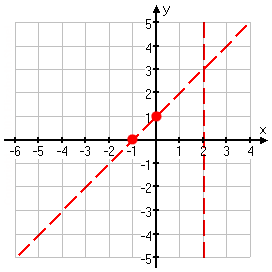
I know that I can't have x = 2 as an x-intercept, because this is actually the vertical asymptote. So I'll ignore that solution of the above equation.
So my intercepts are at (0, 1) and (−1, 0):
Content Continues Below
Now I'll plot a few more points. However, since this example is actually a special case of slant-asymptote graphing (and something of a trick question), I'll add a third column to my T-chart, showing the values for the slant asymptote's line. This way, you can compare the actual function value with the asymptote's value:
| x |
(rational function) |
y = x + 1
(asymptote) |
|---|---|---|
| −6 | y = −5 | |
| −5 | y = −4 | |
| −4 | y = −3 | |
| −3 | y = −2 | |
| −2 | y = −1 | |
| −1 | y = 0 | |
| 0 | y = 1 | |
| 1 | y = 2 | |
| 2 | — y is not defined — | y = 3 |
| 3 | y = 4 | |
| 4 | y = 5 |
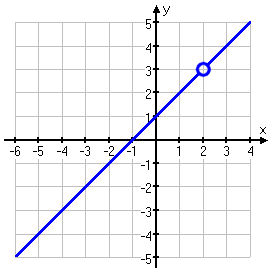
Do you see how, except for the one point where the rational function isn't defined (at x = 2), the two lines are the same? In this special case — where the long division works out with no remainder — you don't actually even need the vertical asyptote lines dashed in. Instead, you find the slant asymptote equation (in this case, y = x + 1), and you draw that in for the rational graph.
The only difference between the slant asymptote of the rational function and the rational function itself is that the rational function isn't defined at x = 2. To account for this, I leave a nice big open circle at the point where x = 2, showing that I know that this point is not actually included on the graph, because of the zero in the denominator of the rational.
Affiliate
Advisory: This graph, being a straight line with an open dot, is not the norm for rationals. But you should expect to encounter a homework exercise like this, and almost certainly there will be a "trick question" like this on the next test. I've only ever seen this done with slant asymptotes, but it could be done with horizontal asymptotes, too. The thing to keep in mind is that you can't just cancel off duplicate factors when graphing rationals; you still need to account for all the zeroes of the denominator.
Can I use my calculator to find the hole?
Your calculator will probably not show a hole in a graph, and trace can miss it too, since it is unlikely that x = 2 will be *exactly* on the pixel that the calculator is processing. But even if the graph does not show the gap in the line, the calculator will show no value for y when x is 2.
What does the hole look like on a graphing calculator?
When I asked my calculator to evaluate the above y for x = 2, I got this:
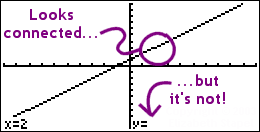
The hole doesn't show up on the graph above because the hole is between two pixels, so the calculator draw the line as connected. If it just so happens that the vertical asymptote falls on a pixel (rather than between two pixels), only then will the gap in the graph be displayed on the calculator's pretty picture.
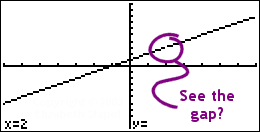
For instance, when I changed the window settings on my graphing calculator so the x-values ran from −7 to 7 (rather than the default −10 to 10), the gap was (just barely) visible:
When you do these graphs, get in the habit of working methodically through all the steps (vertical asymptote(s), horizontal or slant asymptote, intercept(s), plotted points, and graph), so you can do the graphing easily when you get to the test. And, as you can see above, you will need to know this material well enough that your calculator doesn't mess you up.
URL: https://www.purplemath.com/modules/grphrtnl4.htm
You can use the Mathway widget below to practice finding the holes in the graphs of rational functions. Try the entered exercise, or type in your own exercise. Then click the button and select "Find the Holes in the Graph" to compare your answer to Mathway's. (Oddly, if you ask the widget to graph a function with a hole in it, it won't actually show the hole.)
Please accept "preferences" cookies in order to enable this widget.
(Click "Tap to view steps" to be taken directly to the Mathway site for a paid upgrade.)
Select a Course Below
Standardized Test Prep
Homeschool Math
© 2024 Purplemath, Inc. All right reserved. Web Design by ![]()


