Another Example of Graphing Rationals
Purplemath
How do asymptotes help you graph?
Vertical asymptotes let you know where the graph cannot go, and probably where the graph is zooming up or down. Horizontal (and oblique or slant) asymptotes let you know where the graph is going when it's heading off the sides of the screen.
Content Continues Below
Having this asymptote information can cut down on the number of points you need to plot, and can help you find the correct graph without a calculator (which may itself actually show the *wrong* graph, especially around vertical asymptotes).
- Graph the following:
First I'll find any vertical asymptotes, by setting the denominator equal to zero and solving:
x2 + 5x + 6 = 0
(x + 3)(x + 2) = 0
x = −3, x = −2
So I've got two vertical asymptotes:
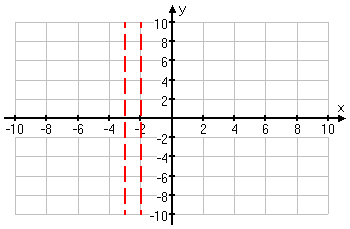
Now I'll look for the horizontal or slant asymptote. The numerator is a cubic (that is, it has degree three) and the denominator is a quadratic (that is, it has degree two). Since the numerator is of greater degree, then this graph has a slant asymptote. I'll use long division to find the equation of the slant asymptote:
Then the slant asymptote is the line y = x − 5. I'll dash this in:
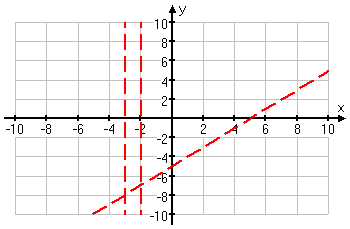
Now I'll find any intercepts, by plugging zero in for each variable, in turn:
y-intercept (so x = 0):
x-intercept (so y = 0):
Affiliate
What did I do with the denominator? I multiplied both sides by the quadratic, so it cancelled out on the right-hand side and zeroed-out on the left-hand side.
What did I do with the quadratic factor, x2 + 2x + 4? I remembered, from learning how to factor sums and differences of cubes, that the quadratic factor, x2 + 2x + 4, derived from factoring the difference of cubes, has no (real-number) solutions, so I couldn't have gotten any x-intercepts from it. Since that quadratic factor is never equal to zero, I could safely divide through and get rid of it.
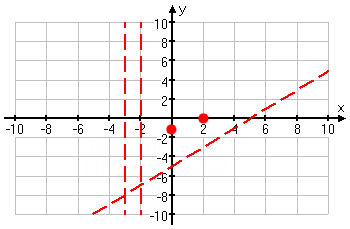
My intercepts are at and (2, 0). I'll add those in:
Content Continues Below
This still leaves a lot of the graph unaccounted for. In order to be sure of what is going on here, I'll plot quite a few more points.
Hmm... Some of those y-values are pretty darned huge....
I think I'll need to redraw my axes just a smidge (okay; a lot), to account for those very large y-values. In particular, I'm going to use a different scale on the y-axis, so that these points will fit in, and I'll label so that the altered axis is clear. Then I'll plot my points.
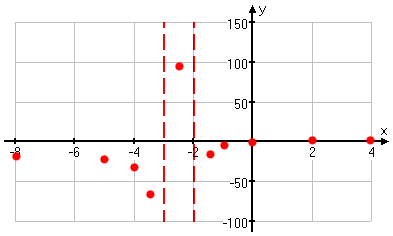
Now that I have a good feel for what the graph is doing, I'll draw it in:
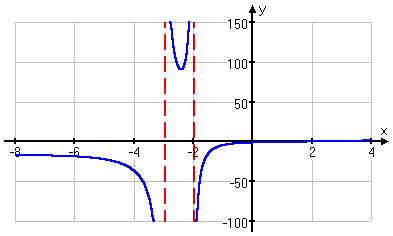
How did I know what the graph was doing in the middle, between the two vertical asymptotes, when I only had the one point? I knew because the two vertical asymptotes cut that section of the graph off from the two side portions, and there was no x-intercept on the interval, so the curve had to be going *up* the vertical asymptotes.
Affiliate
Advertisement
It used to be highly unusual for a graph to have such large y-values, but now that many students are trying to get by with just copying the pretty pictures from their graphing calculators, exercises are being written with graphing calculators in mind. Much of the above graph (especially the middle part) would not show up on the graphing calculator, so a lazy student would be "caught" when he didn't include that middle part in his graph.
For this reason, you shouldn't be surprised occasionally to encounter graphs with very large y-values. When this happens, just adjust your axis scales. I left the x-axis scale fairly small (counting by 2's), but changed the y-axis scale to something large (counting by 50's). Don't think that the axis scales always have to be the same, or that you always have to count by 1's. Be prepared to be flexible.
URL: https://www.purplemath.com/modules/grphrtnl3.htm
You can use the Mathway widget below to practice graphing rational functions. (Or skip the widget, and continue on to the next page.) Try the entered exercise, or type in your own exercise. Then click the button and select "Graph" to compare your answer to Mathway's.
Please accept "preferences" cookies in order to enable this widget.
(Click "Tap to view steps" to be taken directly to the Mathway site for a paid upgrade.)
Select a Course Below
Standardized Test Prep
Homeschool Math
© 2024 Purplemath, Inc. All right reserved. Web Design by ![]()


