Trigonometric Functions and Their Graphs: Tangent
Purplemath
On the previous page, we examined how the sine and cosine ratios for right triangles can be expanded, via the unit circle, to being full-fledged graphable functions. The next trigonometric ratio we'll consider is the tangent ratio. But the tangent's values are difficult to display on the unit circle. This is due to the fact that the tangent is formed by dividing the unit circle's value for sine by its value for cosine, each of which is sometimes zero — and we can't divide by zero.
So, instead, let's take a closer look at the sine and cosines graphs, keeping in mind the fact that tan(θ) is equal to this division: sin(θ) ÷ cos(θ).
Content Continues Below
The tangent, being a fraction, will be zero wherever its numerator (that is, the value of the sine for that angle measure) is zero. The sine is zero at 0, π, 2π, 3π, etc, and at −π, −2π, −3π, and so forth; that is to say, the tangent will have a value of zero at every multiple of π. Let's consider just the region from −π to 2π for now. So the tangent will be zero (that is, it will cross the x-axis) at −π, 0, π, and 2π.
Affiliate
Advertisement
The tangent, being a fraction, will be undefined wherever its denominator (that is, the value of the cosine for that angle measure) is zero. And, thinking back to when you learned about graphing rational functions, you know that a zero in the denominator of a function means you'll have a vertical asymptote. So the tangent will have vertical asymptotes wherever the cosine is zero. Sticking to the same intervale of −π to 2π, the vertical asymptotes will be at −π/2, π/2, and 3π/2. In other words, there will be a vertical asymptote midway between each multiple of π.
Just as the sine and cosine ratios were extended to be functions, so also we can convert the tangent ratio into a function. The tangent will implicitly kinda be a sort of rational function, except that its ratio is formed by dividing two trig functions (rather than two polynomials). This function is denoted as tan(), or just [TAN] on your calculator. This function is periodic, just as are the sine and cosine that form the tangent. But the graph cannot be a nice simple wave, not least due to the vertical asymptotes.
Graphing the tangent function
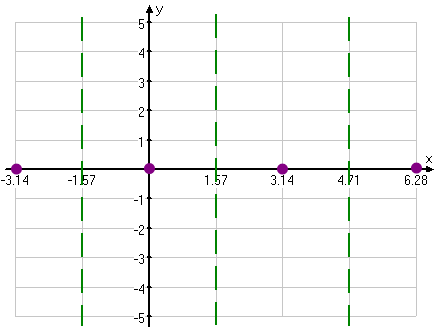
To graph the tangent, let's start with the "interesting" points, being the zeroes and the asymptotes. Put dots for the zeroes and dashed vertical lines for the asymptotes:
← swipe, as needed, to view full image →

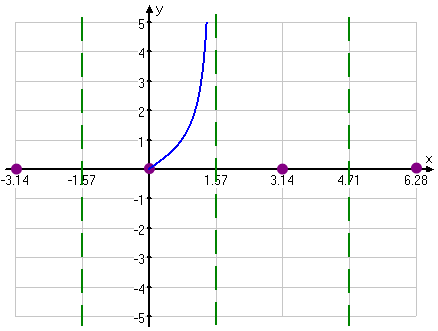
But were does the function go from those zeroes? This is where we use what we know about sine, cosine, and asymptotes to fill in the rest of the tangent's graph. Consider the interval between the zero at 0π and the asymptote at ½π.
- We know that the graph will never touch or cross the vertical asymptotes
- We know that, between a zero and an asymptote, the graph will either be below the axis (and slide down the asymptote to negative infinity) or else be above the axis (and skinny up the asymptote to positive infinity).
- Between zero and π/2, sine and cosine are both positive.
- Then the tangent, being their quotient, must also be positive, so the graph slides up the asymptote.
With this information, we can begin our graph:
← swipe, as needed, to view full image →

Content Continues Below
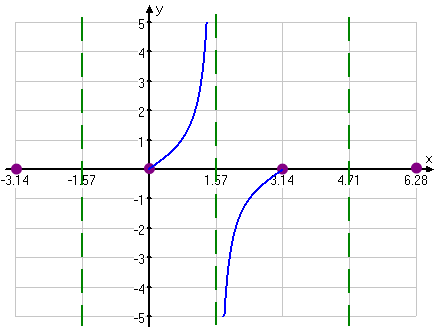
Now let's consider the next interval. Between π/2 and π, sine is positive but cosine is negative. These opposite signs mean that the tangent quotient will be negative, so it will come sliding up the asymptote's right-hand side from below, to curve in and meet the x-axis at x = π. Let's draw that bit in:
← swipe, as needed, to view full image →

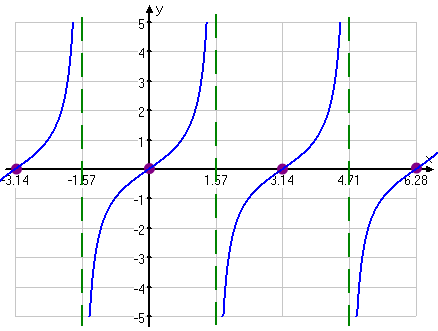
Since sine and cosine are periodic, then tangent has to be periodic, as well. A quick check of the signs tells us how to fill in the rest of the graph:
- −π to −π/2: sine is negative and cosine is negative, so tangent is positive; this portion of the graph must duplicate the graph between 0 and ½π
- −π/2 to 0: sine is negative but cosine is positive, so tangent is negative; this portion of the graph must duplicate the graph between ½π and π
- π to 3π/2: sine is negative and cosine is negative, so tangent is positive; the portion of the graph must duplicate the graph between 0 and ½π
- 3π/2 to 2π: sine is negative but cosine is positive, so tangent is negative; this portion of the graph must duplicate the graph between ½π and π
Using this periodicity (being a pattern that repeats for every multiple of π), we can now complete our graph:
← swipe, as needed, to view full image →

As you can see, the tangent has a period of π, with each period separated by a vertical asymptote. The concept of "amplitude" really doesn't apply. Thanks to the asymptotes, the tangent's values are unbounded; that is, the values go from −∞ to +∞; the range of output y-values is "everything".
Affiliate
For graphing, stick with the "interesting" points. Draw in the zeroes at x = 0, π, 2π, etc (being the same as the zeroes of the sine), and then dash in the vertical asymptotes midway between each zero. Then draw in the curve. You can plot a few more points if you like, but one doesn't generally gain much from doing so.
If you prefer memorizing graphs, then memorize an interval of your choice from the graph above. You might prefer the interval of 0 and π, or perhaps −½π and the asymptote at ½π. Whatever you find useful is the "right" thing to memorize. For myself, I always had trouble keeping straight anything much past sine and cosine, so I used the reasoning demonstrated above to figure out the tangent (and the co-function) graphs.
As long as you know your sines and cosines, and know them well, you'll be able to figure out everything else.
URL: https://www.purplemath.com/modules/triggrph2.htm
Select a Course Below
Standardized Test Prep
Homeschool Math
© 2024 Purplemath, Inc. All right reserved. Web Design by ![]()


