Trigonometric Functions and Their Graphs: Co-functions
Purplemath
As we saw on the previous two pages, the definitions of the sine, cosine, and tangent ratios can be expanded, creating the sine, cosine, and tangent functions. We can do the same with the other ratios; namely, the secant, the cosecant, and the cotangent.
(Note: It's easy to tell that the cotangent corresponds to the tangent, but what of the others? I keep them straight by remembering that the co-secant ratio is the reciprocal of the sine ratio, while the secant ratio is the reciprocal of the co-sine. In other words, I keep them straight by remembering that their correspondence makes no sense to me. I mean, shouldn't co- go with co-? But no.)
Content Continues Below
The Cosecant Function's Graph
The cosecant ratio is the reciprocal of the sine ratio. We create the cosecant function by taking the reciprocal of the sine function's values (except where the sine is zero). And this gives us helpful information for understanding and graphing the cosecant function.
Advertisement
Because the cosecant is the reciprocal of the sine then, whenever the sine is zero, the cosecant will be undefined, because we can't divide by zero. The sine function has a value of zero at every multiple of π, so the cosecant function will have a vertical asymptote at every multiple of π. The sine function waves itself along between the y-values of −1 and +1. The reciprocal of each of these values is itself, so the cosecant will take on these same values at the same angle-values.
Affiliate
Where the sine function is positive, it is between 0 and +1; the reciprocals of these values are between +1 and ever upward, climbing up the vertical asymptote "to" infinity. (Infinity isn't actually a number, so the cosecant's graph will never "arrive" at infinity; its y-values will just keep getting bigger and bigger.) Conversely, where the sine function is negative, it is between 0 and −1; the reciprocals of these values are between −1 and ever downward, skinnying down the vertical asymptote "to" −infinity. (And, no, −infinity isn't a number, either.)
Putting this together, we see that, wherever the sine reaches its maximum value of 1, the cosecant will reach its minimum value of 1; wherever the sine reaches its minimum value of −1, the cosecant will reach its maximum value of −1. Wherever the sine is positive but less than 1, the cosecant will be positive but greater than 1, climbing up asymptotes; wherever the sine is negative but greater than −1, the cosecant will be negative but less than −1, skinnying down asymptotes.
So, to graph my cosecant function, I'll first lightly draw the sine wave:
← swipe to view full image →
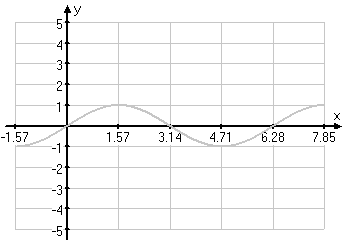
Everywhere the sine crosses the x-axis, I'll draw vertical asymptotes for the cosecant. And I'll draw dots at the sine wave's max/min points, as these will be the cosecant graph's min/max points:
← swipe to view full image →
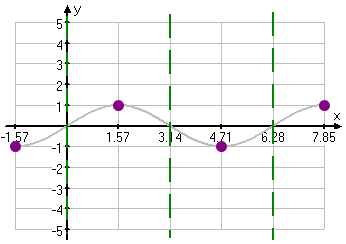
Anywhere the sine is positive, so also is its reciprocal, the cosecant; anywhere the sine is negative, so also is the cosecant. I can use this information to fill in the rest of the cosecant's graph:
← swipe to view full image →
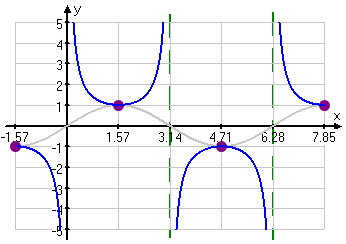
The cosecant's pattern repeats over the same length as does the sine, so the cosecant shares the sine's period of 2π. But, just as with the tangent (and its vertical asymptotes), the concept of "amplitude" doesn't apply to the cosecant.
Note: Don't be afraid to lightly pencil in the sine graph (like I did above) before drawing your cosecant graph. You'll draw the "official" graph darker, and then you'll maybe erase the sine graph before you hand in your work. Just make sure that you have a good understanding of sine waves!
Content Continues Below
The Secant Graph
The secant ratio is the reciprocal of the cosine ratio. We create the secant function by taking the reciprocals of the cosine function's values (except for where the cosine is zero). Sound familiar? Yes, we can understand and graph the secant function using the same logic as we used for the cosecant function.
Affiliate
Wherever the cosine is zero, the secant's graph will have a vertical asymptote. Wherever the cosine has a value of −1 or +1, the secant will have the same value. Over whatever intervals the cosine is positive, so will be the secant; over the intervals where the cosine is negative, so will be the secant.
So, by using the same reasoning and techniques that we used with the sine wave and cosecant graph, I start my secant graph by lightly drawing in the cosine wave. Wherever the cosine crosses the x-axis, I draw a vertical asymptote; wherever the cosine is at a max/min point, I draw the secant's corresponding min/mas point. Then I draw what look like set-union and set-intersection U-type curves between pairs of asymptotes. This allows me to create my secant graph:
← swipe to view full image →
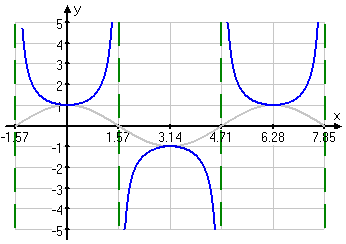
As with cosine, so also with secant: they both have a period of length 2π. As with cosecant and tangent, with their vertical asymptotes, the concept of amplitude does not apply to the secant.
(And to repeat, don't be shy about using what you know about cosines in order to make your life easier when it comes to secants. Lightly rough-in whatever cosine stuff you find helpful and, once you're done with the secant graph, erase whatever cosine stuff you think your instructor might not want to see.)
The Cotangent Graph
The cotangent is the reciprocal of the tangent. Wherever the tangent is zero, the cotangent will have a vertical asymptote; wherever the tangent has a vertical asymptote, the cotangent will have a zero. But flipping a fraction (that is, finding its reciprocal) does not change the sign of the fraction. Therefore, the signs on each interval (between a zero and an asymptote) will be the same for the cotangent as for the tangent.
To graph the cotangent, I first lightly sketch in the tangent graph. (Yes, I still do this.) I convert tangent zeroes to cotangent vertical asymptotes, and tangent asymptotes to cotangent zeroes. Wherever tangent is above the x-axis, the cotangent will be, too, but curving up the other direction; wherever the tangent is below the x-axis, the cotangent will be, too, but curving down the other direction.
Putting it all together, my cotangent graph looks like this:
← swipe to view full image →
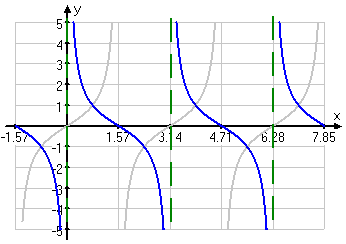
The cotangent has a period of π and the concept of amplitude doesn't apply, just as with the tangent.
When you need to do co-function graphs, you may be tempted to try to compute a lot of plot points. But all you really need to know are your sine, cosine, and tangent functions. Take what you know, and flip that around for whichever co-function you're wanting to graph. From that, you can know where your graph is going to be zero, where it'll be equal to ±1, and where it will have vertical asymptotes. Once you know the behavior of the function at a few points (say, at x = 0, π/2, π, 3π/2, and 2π, then you can fill in the rest. That's really all you need.
URL: https://www.purplemath.com/modules/triggrph3.htm
Select a Course Below
Standardized Test Prep
Homeschool Math
© 2024 Purplemath, Inc. All right reserved. Web Design by ![]()


