Systems of Linear Equations: Special Cases
Purplemath
Most "solving by graphing" system-of-equations problems work nicely, but sometimes they'll give you a system of equations that is a special case. These special cases are (1) an inconsistent system or (2) a dependent system.
This page will show you what these cases look like, both as pairs of equations and as graphs; how to tell the difference between these two special cases; and how to provide valid hand-in answers for each case.
Content Continues Below
What is an "inconsistent" system of equations?
An inconsistdent system of equations is a system that has no solution. If the system is two equations in two variables, then the system will graph as two distinct parallel lines.
Remember that "solutions" are intersections, and parallel lines never intersect each other. Since there are no intersection points for the two parallel lines, then there can be no solution to the original system of equations. If an exercise asks you for the solution of a system that turns out to be inconsistent, your answer should be along the lines of "inconsistent: no solution".
What is a "dependent" system of equations?
Affiliate
Advertisement
A dependent system of equations is a system that has an infinite solution. If the system is two equations in two variables, then the system will graph as one line, because the second equation in the system is actually the same as the first; it will just have been rearranged a bit, and maybe they multiplied through by some number.
Remember back to when you started graphing straight lines. You'd pick an x-value, plug it into the equation they'd given you, and chug away to find the corresponding y-value. Every (x, y) pair that you found was a point on the line — and was also a solution to the equation.
When you discover that you've got a dependent system of equations, the solution to the system is every point where the two lines intersect. But the two lines are actually the same one line, so every point on the line(s) is a solution to the system of equations. The solution will be an infinite set of points.
What is an example of solving a dependent system of equations?
- Solve the following system by graphing.
y = 36 − 9x
3x + y/3 = 12
Since I'm solving this system by graphing, I'll first solve the equations for "y=". The first equation, in this case, is already solved, so now I'll solve the second one:
3x + y/3 = 12
9x + y = 36
y = 36 − 9x
With both equations solved for "y=", I can see that these two equations are really both the same line! So the algebra tells me that this is a dependent system, and the solution is the whole line. Of course, this is a "solving by graphing" problem, so I still have to do the graph, but I already know the answer.
Here's my graph:
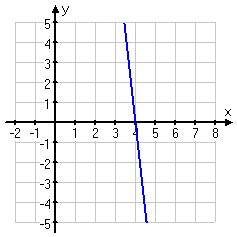
The graph is pretty, but it doesn't really specify what the answer is, so I'll make my answer clear:
solution: y = 36 − 9x
The solution to this system is the whole line, so, in my classes, you could give the answer as being "y = 36 − 9x", and you'd get full credit. However, most textbooks do something weird at this stage.
When solving a system of equations, you know that you are looking for an (x, y)-point where the two lines intersection, and thus is the solution to the system of equations. In this case, the two lines are the same, so they "intersect" at every point along their length, so the solution to the system is the set containing every point on the line(s).
You've got the x-values of the solutions being all x-values, and the y-values of the solutions being the corresponding values of 36 − 9x. (Why? Because y = 36 − 9x.) You know that the solution is the set of all points of this form. Putting this solution in (x, y)-point form, we see that the answer is:
the set of all points (x, 36 − 9x)
But when you check in the back of the book to see if your answer is correct, you see something like this:
(a, 36 − 9a)
Where the heck did "a" come from?
Your textbook, instead of using x, which is a perfectly good variable, pulls out this new variable from behind its left ear and gives the solution as being "(a, 36 − 9a)" or "(t, 36 − 9t)". I have no idea why textbooks do this, but if your book does this, then this may be the answer format that your teacher will want on the test. Ask your instructor, before the test, which solution format(s) are acceptable. If you are expected to match whatever the textbook does, then make sure you memorize the variable that your particular book uses.
Content Continues Below
What is an example of solving an inconsistent system of equations?
- Solve the following system by graphing.
7x + 2y = 16
−21x − 6y = 24
Since I'm solving by graphing, I'll first solve each equation for "y=". The first equation solves as:
7x + 2y = 16
2y = −7x + 16
y = −( 7/2 )x + 8
That's one equation solved. Now I'll do the other one:
−21x − 6y = 24
−21x − 24 = 6y
−(21/6)x − 4 = y
−(7/2)x − 4 = y
These lines have the same slope — namely, m = −7/2 — but different y-intercepts, so they are two distinct parallel lines. Since parallel lines never cross, the algebra tells me that this is an inconsistent system; that is, that this system of equations has no solution. But this is a "solving by graphing" problem, so I still have to draw the picture. Here:
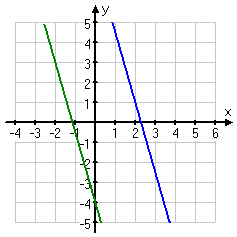
However, despite this being a "solving by graphing" exercise, they still expect me to say, explicitly, what the solution is. So:
no solution (inconsistent system)
By the way, when the algebra tells you that you have two parallel lines (as in the exercise above) then please draw the lines on your graph so they look parallel. Just cuz there's no solution, is no excuse for being sloppy.
Affiliate
Note: The solution to a dependent system, being all the points along the line, contains infinitely-many points. But don't make the mistake of thinking that "infinitely-many" points means "all" points. Any point off the line is not a solution; only the infinity of points actually on the line will solve the dependent system.
Also note: The pictures on the first page of this lesson are very useful for explaining "what's going on" with linear systems (that is, they're good for explaining the concepts), but pictures are not terribly useful for finding actual numerical solutions to actual systems of any complexity at all. For instance, in the picture below, is the solution point at (−3, 2), or it is maybe actually at (−3.15, 1.97)?
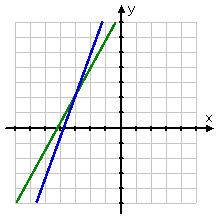
You can't tell!
Or, in the picture below, are the lines really parallel, so there's no solution? Or are you just looking at an un-useful portion of the graph?
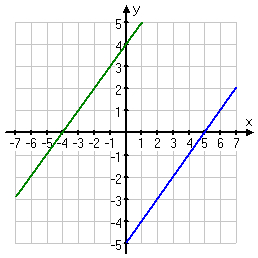
You can't tell!
At least, you can't tell in the "standard" graphing window, as used in the above picture. However, zooming out shows that those lines do indeed cross, at the point (450, 449.5).
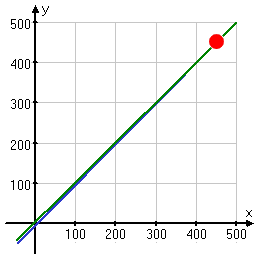
So you can see that the pictures can be useful, especially for the concepts, but you should take "solving by graphing" with a grain of salt, and should keep in mind that the algebraic techniques (rather than mere pictures) are the tools you need for solid, precise answers.
The above discussion was specific to the two-equation, two-variable case, because you can draw pictures of the two-variable case to illustrate what is going on. But the terminology and basic concepts are the same, no matter how many variables you have. You could have four equations in four variables or twelve equations in twelve variables, and you would still be looking for where the "lines" "intersect" — you just couldn't draw a picture of it.
Formatting note: For reasons which will become apparent when you start working with matrices, equations in systems of equation are generally written with the variables on the left-hand side of the "equals" sign and the numbers on the right-hand side. Sometimes you'll find a question formatted differently, but variables-on-the-left will be the norm.
URL: https://www.purplemath.com/modules/systlin3.htm
Select a Course Below
Standardized Test Prep
Homeschool Math
© 2024 Purplemath, Inc. All right reserved. Web Design by ![]()


