Systems of Linear Equations: Graphing
Purplemath
When you are solving systems of equations (linear or otherwise), you are, in terms of the equations' related graphed lines, finding any intersection points of those lines.
If a system of equations consists only of a pair of two-variable linear equations, then this system's equation can be graphed; the graph will contain two straight lines, and the solution to the system will be the intersection point(s) of those lines. Because two straight lines in the plane can graph in only three types of ways, there are then only three corresponding forms of solution for a given system of equations.
Content Continues Below
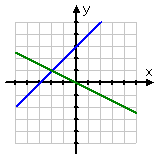
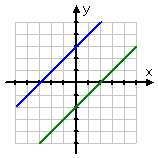
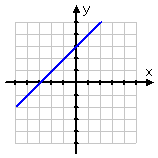
Two straight lines (1) have different slopes and intersepts, so they cross at exactly one point, (2) are parallel with different intercepts, so they never intersect at any points, or (3) they have the same slope and intersepts, so they're really the same line, so they "intersect" everywhere (where "everywhere" means "everywhere the one line goes, so goes the other line; they have all their points — infinitely-many points — in common"). These three cases for pairs of straight lines are illustrated below:
Case 1 |
Case 2 |
Case 3 |
|
|
|
The first graph above, being "Case 1" in the left-hand column, shows two distinct non-parallel lines that cross at exactly one point. The corresponding system of equations is called an "independent" system, and the solution is a single (x,y)-point.
Independent: |
Case 2 |
Case 3 |
|
|
|
The second graph above, being "Case 2" in the middle column, shows two distinct lines that are parallel. Since parallel lines never cross, then there can be no intersection of these lines; that is, for a system of two linear equations that graphs as two parallel lines, there can be no solution. This is called an "inconsistent" system of equations.
Independent: |
Inconsistent: |
Case 3 |
|
|
|
The third graph above, being "Case 3" in the right-hand column, appears to show only one line. Actually, it's the same line drawn twice. These "two" lines, really being the same one line, "intersect" (in a technical sense) at every point along their lengths. This means that every point on the line(s) is a solution to the system. This is called a "dependent" system, and the "solution" is the whole line.
Independent: |
Inconsistent: |
Dependent: |
|
|
|
This shows that a system of equations may have one solution (a specific x,y-point), no solution at all, or an infinite solution (being all the solutions to the equation). You will never have a two-linear-equation, two-variable system with two or more solutions; it will always be one, none, or infinitely-many.
Content Continues Below
If it's a dependent system, why isn't "infinite" or "all points" a valid answer?
Affiliate
While the solution to a dependent system of linear equations is an infinite set of points, "infinty" is not a number, "infinite" isn't sufficiently clear, and points off the system's line(s) are not solutions. Only those points that are actually on the line are solutions to the system. So your answer for system type would be "dependent", but the solution would actually be the line's equation, as this equation implicitly lists all the points that solve the system.
For instance, if the two equations in a dependent system reduced down to y = −x + 3, then you should state the solution as being that line equation, or you could use coordinate-pair notation; namely, (x, −x + 3).
Solving by Graphing
Probably the first method you'll see for solving systems of equations will be "solving by graphing". Warning: You have to take these problems with a grain of salt. The only way you can find the solution from the graph is IF you draw a very neat axis system, IF you draw very neat lines, IF the solution happens to be a point with nice neat whole-number coordinates, and IF the lines are not close to being parallel.
For instance, if the lines cross at a shallow angle it can be just about impossible to tell where the lines cross.
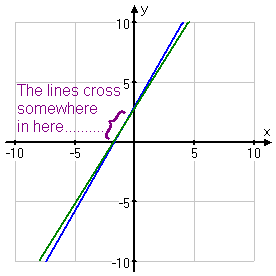
And if the intersection point isn't a neat pair of whole numbers, all bets are off. I mean, can you tell, just by looking...
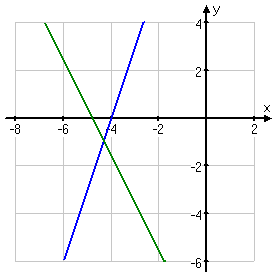
...that the displayed intersection above has coordinates of (−4.3, −0.95)? No? Then you see my point.
On the plus side, since they will be forced to give you nice neat solutions for "solving by graphing" problems, you will be able to get the right answers as long as you graph very neatly. For instance:
Solve the following system by graphing.
Advertisement
Affiliate
2x − 3y = −2
4x + y = 24
I know I need a neat graph, so I'll grab my ruler and get started. First, I'll solve each equation for "y=", so I can graph easily:
2x − 3y = −2
2x + 2 = 3y
(2/3)x + (2/3) = y
4x + y = 24
y = −4x + 24
The second line will be easy to graph using just the slope and intercept, but I'll need a T-chart for the first line.
x |
y = (2/3)x + (2/3) |
y = −4x + 24 |
−4 |
−8/3 + 2/3 = −6/3 = −2 |
16 + 24 = 40 |
−1 |
−2/3 + 2/3 = 0 |
4 + 24 = 28 |
2 |
4/3 + 2/3 = 6/3 = 2 |
−8 + 24 = 16 |
5 |
10/3 + 2/3 = 12/3 = 4 |
−20 + 24 = 4 |
8 |
16/3 + 2/3 = 18/3 = 6 |
−32 + 24 = −8 |
Sometimes you'll notice the intersection right on the T-chart. Do you see the point that is in both equations above? Check the gray-shaded row above.
Now that I have some points, I'll grab my ruler and graph neatly, and look for the intersection:
Even if I hadn't noticed the intersection point in the T-chart, I can certainly see it from the picture.
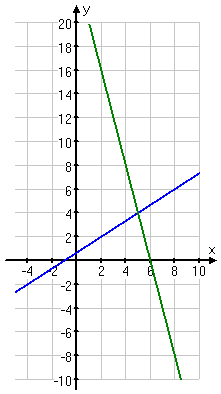
solution: (x, y) = (5, 4)
When you're stuck doing "solving by graphing", please, for heaven's sake, draw the lines so they actually cross at the solution point. Don't be sloppy!
You can use the Mathway widget below to practice solving by graphing (or skip the widget, and continue on to the next page). Try the entered exercise (by clicking the arrow and selecting "Solve by Graphing" in the pop-up box), or type in your own exercise. Then compare your answer to Mathway's. (Or skip the widget, and continue with the lesson.)
Please accept "preferences" cookies in order to enable this widget.
(Click here to be taken directly to the Mathway site, if you'd like to check out their software or get further info.)
URL: https://www.purplemath.com/modules/systlin2.htm
Select a Course Below
Standardized Test Prep
Homeschool Math
© 2024 Purplemath, Inc. All right reserved. Web Design by ![]()


