Graphing Systems of Nonlinear Equations
Intro ConceptsSolving Simple SystemsSolving Intermediate SystemsSolving Advanced SystemsSolving w/ Quadratic Formula
Purplemath
The previous page refreshed us on the relationship between solutions of equations and the points on the associated plots of those equations' lines. This topic was probably last mentioned in class back when you first learned about graphing linear equations, and you may have been forgotten since.
Content Continues Below
But the issue is important for solving systems of equations, too. Why? Because the solution to a system of equations is going to be a solution for all of the equations in the system. Then that solution must be a plot point for all of the associated lines' graphs. But where will different lines have the same plotted point? Where those lines intersect.
Suppose you have the following exercise:
- Solve the system by graphing:
y = x2
y = 8 − x2
I can graph each of these equations separately. Here's the graph for y = x2:
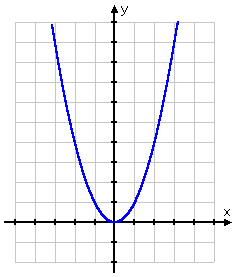
And here's the graph for y = 8 − x2
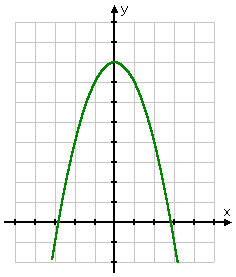
..and each point on each graph is a solution to that graph's equation.
Now look at the graph of the system, which shows both curves — y = x2 and y = 8 − x2 — on the same axis system:
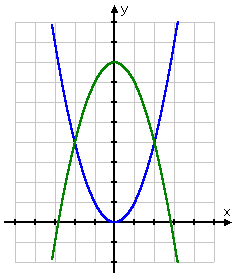
A solution to the system is any point that is a solution for both equations. In other words, a solution point for this system is any point that is on both graphs. In other words:
SOLUTIONS
OF SYSTEMS
ARE
INTERSECTIONS
OF LINES
Then, graphically, the solutions for this system are the red-highlighted points below:
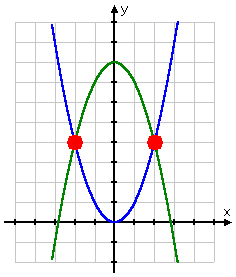
That is, the solutions to this system are the intersection points at:
(−2, 4) and (2, 4)
So when you're trying to solve a system of equations, you're trying to find the coordinates of the intersection points.
Content Continues Below
The system in the above example had two solutions, because the graph shows two intersection points. Different systems can have different numbers of solutions. For instance, a system can have one solution:
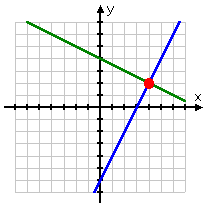
A system can have lots of solutions:
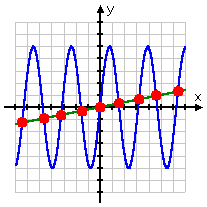
And some systems no solutions at all:
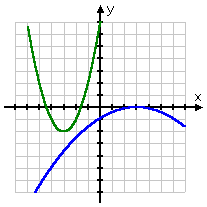
(In this last situation, where there was no solution, the system of equations is said to be "inconsistent".)
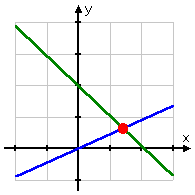
When you look at a graph, you can generally only guess at an approximation to the solution. Unless the solutions points are nice neat numbers (and unless you happen to know this in advance), you can't get the solution from the picture. For instance, you can't tell what the solution to the system graphed below might be:
Advertisement
...because you're having to guess from a picture. As it happens, the solution is (x, y) = (13/7, 9/14), but you would have no possible way of knowing that from this picture.
Affiliate
Advisory: Your text will almost certainly have you do some "solve by graphing" exercises. You may safely assume for these exercises that answers are nice and neat, because the solutions must be if you are to be able to have a chance at guessing the solutions from a picture. But you can make this graphical assumption *only* in this specific context.
This "solving by graphing" can be useful, in that it helps you get an idea in picture form of what is going on when solving systems. But it can be misleading, too, in that it implies that all solutions will be "neat" ones, when most solutions are actually rather messy.
URL: https://www.purplemath.com/modules/syseqgen2.htm
Select a Course Below
Standardized Test Prep
Homeschool Math
© 2024 Purplemath, Inc. All right reserved. Web Design by ![]()


