An Introduction to Systems of Non-Linear Equations
Graphing ConceptsSolving Simple SystemsSolving Intermediate SystemsSolving Advanced SystemsSolving w/ Quadratic Formula
Purplemath
What are systems of equations?
A system of equations is a set of equations that you work with as a group. A solution to a system of equations is a solution to each and every equation in the system; in other words, a solution to the system is the intersection of all the equations' graphs.
Content Continues Below
Real-world systems of equations can have dozens, hundreds, thousands of equations with at least as many variables. But you'll likely be dealing with systems of only two equations in two variables.
Affiliate
What is a non-linear equation?
A non-linear equation is one with at least one term containing two variables or at least one term containing a variable of degree two or greater. For instance, y = 2x is a linear equation (which will graph as a straight line), while y = 2x2 is a non-linear equation (which will graph as some sort of curved line).
What are systems of non-linear equations?
A system of non-linear equations is a collection of equations, at least one of which does not graph as a straight line. Because some or all of the lines are curved, there is the possibility of many intersection points and thus many solutions.
What are solutions to systems of equations?
Solutions to systems of equations are the coordinates of the points where the equations' lines intersect. Where graphed lines cross, systems find their solutions.
Content Continues Below
(Yes, I'm harping on and on about system solutions being intersection points, and vice versa; yes, I'm going to harp some more. It's important.)
Think back to when you were first learning about solving one-variable linear equations. The solutions to the equations were the points that made the equation true; that is, the variable values that made the equation work correctly.
For instance, in the equation 2x = −6, the solution is x = −3 because, if you plug in −3 for x, you will get a true statement:
2(−3) = −6 = −6
Advertisement
On the other hand, x = 3 is *not* a solution to the equation, because plugging 3 in for x would create a false statement:
2×3 = 6 ≠ −6
Affiliate
Eventually, you moved on to two-variable equations, such as y = 3x + 2. You could evaluate these equations (usually meaning that you were given a value for x which you plugged in, and then you solved for the value of y). Or you could graph the equations.
You could also check solutions. For instance, suppose you were given y = x − 4. Is the point (6, 3) a solution? No, because plugging in 6 for x and 3 for y makes the equation false:
Since 2 does not equal 3, then the given point makes the equation untrue.
So (6, 3) is not a solution to this equation. But (6, 2) is:
Since 2 does in fact equal 2, then the given point makes the equation true.
But you would not usually work with the equation in this way; you would usually be picking x-values, plugging them into the equation, finding the corresponding y-values, plotting the points, and graphing the line.
For instance, you would pick 6 for x, plug this in to the equation, and compute y as:
y = x − 4
y = (6) − 4
y = 2
Again, we arrive at the point (6, 2) being a solution to the equation.
With either of these two methods, you would have shown that (6, 2) is a solution to the equation. That's the important concept to see here:
For single equations:
SOLUTIONS FOR EQUATIONS
ARE
POINTS ON THE GRAPHS
When, instead of working with one equation at a time, you are solving a system of equations, you are looking for the points that are solutions for *all* of the system's equations. In other words, you are looking for the points that are solutions for all of the equations at once. What does this mean?
For systems of equations:
SOLUTIONS FOR
SYSTEMS OF EQUATIONS
ARE
POINTS ON ALL
OF THE GRAPHS
What do solutions of systems of nonlinear equations look like, graphically?
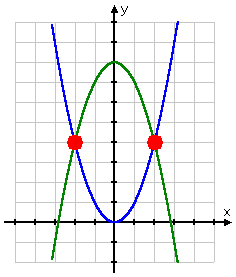
The solution to a system of equations, when drawn on a graph, will be the points where the lines intersect (that is, where they touch or cross each other). The system graphed below shows two solution points:

If you plug a system of non-linear equations into your graphing calculator, the resulting picture can be useful for seeing, in general terms, where your answers should be. But you'll still need to do the algebra to find the exact values (which is precisely what we'll be doing with the above-graphed system later).
URL: https://www.purplemath.com/modules/syseqgen.htm
You can use the Mathway widget below to confirm the relationship between solutions and intersections. Try the entered pair of equations, or type in your own equations. Then click the button and select "Solve the System of Equations" or "Find the Points of Intersection"; note the answer given by the widget. Then click on the equations to re-enter them, and this time select the other of the two options. Is there any difference? And what do the graphs show?
Please accept "preferences" cookies in order to enable this widget.
(Click "Tap to view steps" to be taken directly to the Mathway site for a paid upgrade.)
Select a Course Below
Standardized Test Prep
Homeschool Math
© 2024 Purplemath, Inc. All right reserved. Web Design by ![]()


