An Introduction to Solving Quadratic Inequalities
Purplemath
What is the concept behind solving quadratic inequalities?
The concept behind solving quadratic inequalities is pretty much the same as for solving linear inequalities: You find the x-intercepts; these split the number line into intervals. Then you pick the useful intervals.
Content Continues Below
Let's first refresh on, and expand a bit upon, the process of solving linear inequalities.
Affiliate
Advertisement
When you learned about solving inequalities like x − 4 < 0, the process was pretty straightforward; you'd add the 4 over to the other side, getting x < 4. This inequality solution was often formatted as being half of a number line; for this inequality, it would be the left-hand half of the number line, being all the numbers that are less than 4.
So far, so simple. But now they went and made it harder, with quadratic inequalities.
There is a big jump between linear inequalities and quadratic inequalities. Part of the jump is the fact that concepts which were skipped over in learning how to solve linear inequalities are useful, even needful, in solving quadratic inequalities. So let's first look at a linear inequality, and cover those concepts that were skipped earlier.
- Solve x − 4 < 0.
I already know that the solution is x < 4; graphically, it's the number line with an intercept at x = 4, and the line is shaded to the left, sort-of like this:
(Yes, that solution graph probably does look a bit odd. Stick with me; you'll soon see why it looks like that.)
The number line is one-dimensional. Let's look at the two-variable, two-dimensional associated equation — namely, y = x − 4 — and its graph:
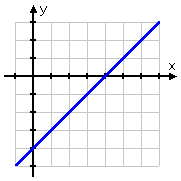
The inequality x − 4 < 0 is asking "when is the line y = x − 4 below the line y = 0?" Since the line y = 0 is just the x-axis, the inequality is therefore asking "when is the line y = x − 4 below the x-axis?"
Well, the graph makes that pretty obvious: the line is below the axis to the left of x = 4, and above the axis to the right:
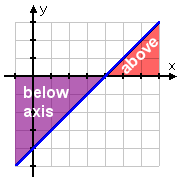
The original question asked me to solve x − 4 < 0, so I need to find where the line is below the x-axis. This happens on the left-hand side of the intercept:
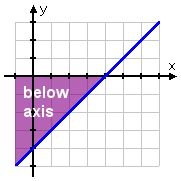
Since the original inequality asked only about the x-values, I'll restrict the above two-dimensional graph to just the one-dimensional x-axis:
(And now you can see where the funky number line came from.)
All I had to do to solve the inequality was find the x-intercepts, and then think of the general shape of the line — in particular, using the value of the slope to tell me which way the line was heading into and out of that intercept. This leads to a very helpful analogue for solving quadratic inequalities.
Content Continues Below
How do you solve a quadratic inequality, step by step?
- If needed, gather all the terms onto one side of the inequality, with zero on the other side.
- Set the quadratic equal to zero, and solve for the x-intercepts. These will usually divide the number line into three intervals.
- Consider the associated quadratic function, and the parabola which is its graph. If the quadratic is positive, then its parabola opens upward, and the two intervals at the ends of the number line will be above the axis; if it's negative, then its parabola opens downward, and the interval in the middle, between the intercepts, will the above the axis.
- If the inequality is less-than, then take the intervals where the parabola is below the axis; if greater-than, then take the intervals where the parabola is above the axis.
(Your textbook probably uses "test points" for step (3) above. If you *have* to use test points — like if your instructor requires that you show that you've tested points on each interval — then go ahead and do that. But use the method I've outlined above, and will demonstrate below, to get your answer quickly and for certain.)
Let's take a look at how this works in practice:
- Solve −x2 + 4 < 0.
The quadratic is isolated on the left-hand side of the inequality, with zero on the other side, so I can skip that step.
Now I need to find the zeroes (that is, the x-intercepts) of this quadratic:
−x2 + 4 = 0
x2 − 4 = 0
(x + 2)(x − 2) = 0
x = −2, +2
So the quadratic's parabola crosses the x-axis at x = −2 and at x = 2, splitting the number line into three intervals.
They gave me a "less than" inequality, so now I need to figure out where (that is, on which intervals) the graph is below the x-axis. But that's easy! Since this is a negative quadratic, it graphs as an upside-down parabola. In other words, the graph is high (that is, the graph is above the axis) in the middle, and low (that is, below the axis) on the ends:
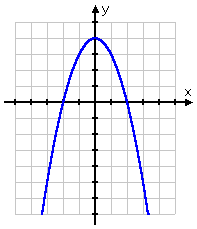
This tells me that the solution is the two intervals on either end, rather than the interval in the middle:
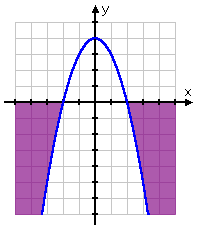
Then the solution is clearly:
x < −2 or x > 2
If your instructor requires test points to be shown being tested, then you'll need to pick an x-value from each interval. For instance, you could use x = −3 for the first (left-hand) interval, x = 0 for the second (middle) interval, and x = 3 for the third (right-hand) interval.
So if you're using x = −3 for testing the sign on the first interval, you'd plug 3 for x and get y = −5, which is negative, which means that the first interval is included in the less-than solution. And so forth.
Yes, simply picturing the parabola in your head is *so* way easier than having to do test points.
Affiliate
Note that I could have multiplied the original inequality through by −1, giving me x2 − 4 > 0. The zeroes would have been the same: x = −2 and x = 2. But this parabola would have been right-side-up, since the quadratic would have been positive. That's okay though, because, by multiplying through by −1, I would have flipped the inquality, so I would have been looking for where the quadratic is greater than zero (that is, where the parabola is above the axis). Since the parabola would have been right-side-up, the graph would have been above the axes on the ends; so the solution would have worked out to be the same as before: x < −2 or x > 2:
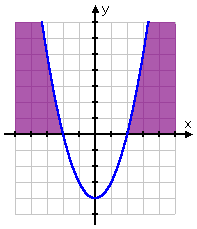
If you feel more comfortable working only with quadratics with a positive leading coefficient (that is, a positive number multiplied onto the x2 term), then multiply both sides of the inequality by −1 (remembering to flip the inequality symbol). This is a perfectly valid mathematical step.
URL: https://www.purplemath.com/modules/ineqquad.htm
Select a Course Below
Standardized Test Prep
Homeschool Math
© 2024 Purplemath, Inc. All right reserved. Web Design by ![]()


