Graphing Trig Functions: Phase Shift
Purplemath
You're familiar with the basic trig graphs. These graphs each start at x = 0 and repeat every 2π units (for sine, cosine, secant, and cosecant) or every π units (for tangent and cotangent). Shifting these graphs up or down is easy; shifting them sideways can seem... less easy.
Content Continues Below
What is phase shift?
Trigonometric functions have distinct cycles, or "phases"; think of first period of the basic sine wave. A phase shift means nothing more than shifting a given trig function to the left or right, so that the cycle starts at a non-regular point; in other words, that the graph has been shifted a bit to one side or the other.
How do you graph with phase shift?
To graph a trig function with a phase shift, I find it helpful to do the graph over the regular interval (where I'm well familiar with the graph being), and then moving the axes.
I'll show you what I mean:
-
Graph two periods of
The amplitide of this graph is going to be the same as for regular sine waves because, when "nothing" is multiplied on the sine, then there's an "understood" 1 multiplied on the sine. This understood 1 is the amplitude.
There is a vertical shift on this function from the +3 after the sine. Instead of winding up and down around the line y = 0 (that is, up and down around the x-axis), the midline of this graph is going to be at y = 3.
The regular period for sine waves is 2π, but the variable in this function is multiplied by π; doing the division, the period of this particular function is going to be . Since I have to "graph least two periods" of this function, I'll need my x-axis to be at least four units long.
Now I get to the new part of graphing, being the phase shift. Looking inside the argument, I see that there's something multiplied on the variable, and also that something is added onto it. To figure out the actual phase shift, I'll have to factor out the multiplier, π, that's on the variable.
The argument factors as . Now I can see that there's a added to the variable, so the graph will be shifted units to the left.
To do this sine graph, I'll start with the usual sine graph:
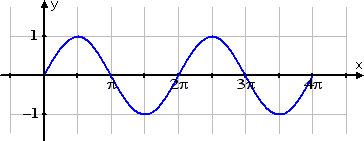
I know that this graph has a vertical shift upwards of three units. But, instead of shifting the graphed sine wave three units up, I'll add room underneath my current graph, shift the horizontal axis three units down, and then re-number the y-axis:
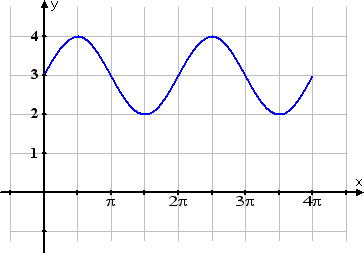
The above is the same graph as the first one I did, but all I've really done is moved the x-axis down three units, redrawn and relabelled it, and then renumbered the y-axis. I haven't touched the graphed sine wave, shown above in blue.
The regular period for sine waves goes from 0 to 2π; this one goes from 0 to 2, so I'll re-number the x-axis:
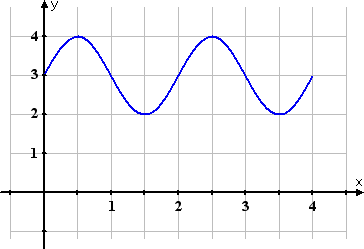
All I've done in the above graph is relabel the x-axis from π, 2π, 3π, and 4π to 1, 2, 3, and 4, respectively. I still haven't touched my blue graphed line.
Content Continues Below
From the phase-shift computations, I know that the graph is shifted to the left by , so I'll shift the y-axis to the right by and re-number the x-axis again. This is the last bit of computation, so this is my final graph:
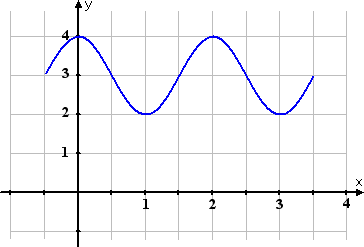
All I did to get the last graph above was erase the existing y-axis, redraw it half a unit to the right, and then erase and rewrite the labels on the x-axis, again half a unit to the right. I never touched my blue-line graph.
Can you see why I used pencil and did a lot of erasing when I was doing graphing?
My best advice regarding doing these graphs is to practice, practice, practice. You don't want to freeze or have a "brain-fart" on the test, and this is pretty straightforward once you get the feel of it. So keep doing extra graphing, until you are feeling comfortable and confident in your skills.
How do you graph trig functions on a TI-84?
To graph a trigonometric function on a TI-84, first make sure that all the "modes" match; that is, make sure that you have everything set either to "degrees" or to "radians". I have things set to radians, so I'll show how to graph in that mode.
In mode, make sure you've selected the mode that you want. I've selected radian:
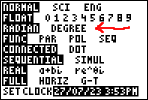
I'm using the function y = 2sin(3x − 4) for this example:
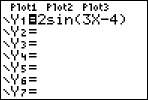
This function has a phase shift. By restating the function as , I can see that the phase shift is 4/3 units to the right. To have table show useful values, I'll change the TblStart to be . Because the variable is multiplied by a 3, I know that the period is going to be units long. So I'll set the ΔTbl — that is, the amount by which the variable will be incremented in table — to be , as this should hit all of the "interesting" graph points.
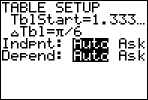
(After you've entered one of the table values, it will change to a decimal approximation as soon as you move anywhere else. That's why the that I'd entered in the TblStart shows 1.333... now that I've moved the cursor to enter the increment value on the next line. This is okay; just know to expect this sort of "helpfulness" from the calculator.)
I'd like the scale on my x-axis to be helpful, so I'll choose ZTrig from the zoom menu.
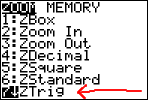
Now that everything is set up the way I'd like, I can do the graph, which shows the amplitude being 2 (in case I'd forgotten):
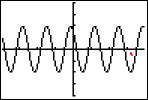
I can confirm my plot points in table:
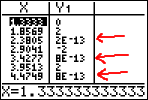
Some of the values in table are very small, such as 2E−13, which is 0.000 000 000 000 2. This is an indication of round-off error inside the calculator; I know that these teeny-tiny values are, for graphing purposes, equal to zero. The other values in table are −2, 0, and +2, which are the max/min points and the points halfway between the max/min points.
Does all of the above seem like quite a bit of trouble to go to for drawing a simple graph? I agree; it is. When working with trig functions, especially those having a phase shift, it may be easier *not* to use the graphing calculator.
You can use the Mathway widget below to practice finding the amplitude, period, and phase shift. Try the entered exercise, or type in your own exercise. Then click the button, selecting "Find Amplitude, Period, and Phase Shift" from the list of options, to compare your answer to Mathway's. (You can also select "Graph".)
Please accept "preferences" cookies in order to enable this widget.
(Click "Tap to view steps" to be taken directly to the Mathway site for the option to purchase a membership.)
URL: https://www.purplemath.com/modules/grphtrig3.htm
Select a Course Below
Standardized Test Prep
Homeschool Math
© 2024 Purplemath, Inc. All right reserved. Web Design by ![]()


