Graphing Trigonometric Functions: Examples
Purplemath
If you know the basic trigonometric graphs, then the more-complicated graphs (being those that have been translated and/or transformed) can be fairly easy to draw.
(No, I do not, in general, advise trying to graph a function by starting with the "basic" graph and then translating the points for the translated graph. In general, that process is more trouble than it's worth.)
Content Continues Below
(But, for trig function, translating the "basic" graph is, in my experience, by far the best method to use.)
How do you graph translated/transformed trigonometric functions easily?
To easily graph shifted (that is, non-"basic") trig graphs, follow these steps:
- Compute the amplitude, period, vertical shift, and phase (that is, horizontal) shift of the non-basic trig function.
- Draw the regular (that is, the basic) axis system and graph for the trig function. (Use the usual "interesting" graphing points: at x = 0, π/2, π, 3π/2, and π.)
- If the non-basic function has a negative amplitude, flip the basic graph upside-down.
- If the non-basic function has an amplitide other than |1|, adjust the peaks and troughs of the basic graph to match the non-basic function.
- If there is a vertical shift, move the graphed dots upward or downward by the appropriate amount (or, which is the same thing, move the axis system downward or upward by the appropriate amount).
- If there is a phase shift, relabel the axis system so the basic graph's period is shown as starting at the correct non-basic graph's starting point.
In other words, to graph a non-basic trig function, do the regular basic graph, and then shift and/or relabel.
-
Graph one period of s(x) = −cos(3x)
There is a "minus" sign on this cosine, which tells me that the graph is going to be upside-down from the basic cosine's graph.
There is nothing added to or subtracted from the outside of this cosine, so there is no vertical shift.
There is nothing added to or subtracted from the inside of this cosine, so there is phase shift.
There is a 3 multiplied on the variable inside this cosine, so the graph is growing three times as fast as that of the basic cosine's graph, so the period is one-third of the length of the basic cosine's period. Therefore, the period for this graph will be .
I'll start with the regular graph of cosine:
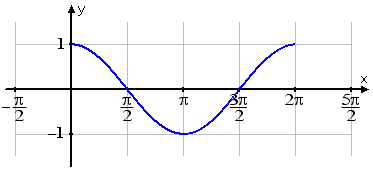
I need to flip this upside down, so I'll swap the +1 and −1 points on the graph:
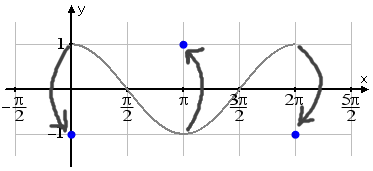
...and then I'll fill in the rest of the graph. (The original, "regular", graph is shown in gray below; my new, flipped, graph is shown in blue.)
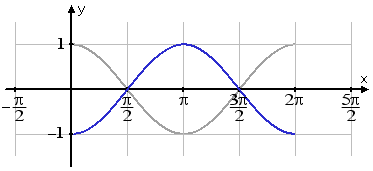
Okay, that takes care of the amplitude. There is no vertical shift or phase shift. So now I need to change the period to reflect the fact of the 3 that's multiplied inside.
Affiliate
Rather than trying to figure out the points for the graph on the regular axis, I'll instead re-number the axis, which is a lot easier.
The regular period is from 0 to 2π, but this graph's period goes from 0 to . Then the midpoint of the period is going to be halfway between zero and — at — and the zeroes (that is, the x-intercepts) will be midway between the peaks (that is, the high points) and the troughs (that is, the low points). So I'll erase the x-axis values from the regular graph, and re-number the axis.
The following is my final (hand-in) graph:
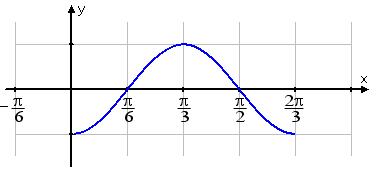
Notice how I changed the axis instead of the graph. You'll quickly get pretty good at drawing a regular sine or cosine, but the shifted and transformed graphs can prove difficult. Instead of trying to figure out all of the changes to the graph, just tweak the axis system instead.
Content Continues Below
The previous example showed how to change things around for the amplitude and the period. The next example shows how to move things around for a vertical shift.
-
Graph at least one period of f(θ) = tan(θ) − 1
The regular basic tangent graph looks like this:
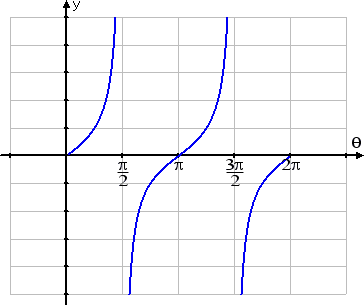
The graph for tan(θ) − 1 is the same shape as the regular tangent graph, because nothing is multiplied onto the tangent, nor onto the variable inside the tangent. In other words, there is no change to the period or amplitude, and there is no phase shift.
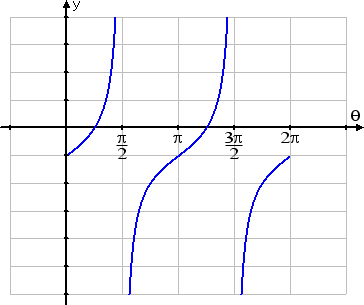
But this graph is shifted down by one unit. In other words, instead of the graph's midline being the x-axis (that is, the line y = 0), it's going to be the line y = −1.
Rather than trying to figure out the points for moving the tangent curve one unit lower, I'll just erase the original horizontal axis and re-draw the x-axis one unit higher. Then my final (hand-in) graph of one period of the shifted function looks like this:
You may, at first, want to use scratch-paper for the various changes (flipping graphs upside-down, moving axes up and down, changing the measurements on the x-axis, etc), so your hand-in homework isn't full of erasures. But get used to working neatly, from start to finish, on the hand-in sheet, so your work on the next test will be acceptable.
Affiliate
Hint: Start by drawing lightly in pencil, and have a good eraser (like from an office supply or craft store). Be sure you're using a ruler for your final drawing. Also, it can be helpful to use a regular pencil for the temporary "basic" graph, but then use colored pencils for your final version.
How do you graph trig functions with degrees?
To graph a trigonometric function where the argument is in degrees (rather than in radians), use the standard equivalence: π ↔ 180°, and label the x-axis at 0°, 90°, 180°, 270°, and 360°. (Add tick-marks halfway between these x-values.) If you're computing y-values for anything other than the basic reference angles, then make sure that your calculator is set to "degree" mode, rather than to "radian" mode, so that you get the correct values.
Otherwise, graphing with degrees works exactly the same way as graphing with radians.
URL: https://www.purplemath.com/modules/grphtrig2.htm
Select a Course Below
Standardized Test Prep
Homeschool Math
© 2024 Purplemath, Inc. All right reserved. Web Design by ![]()


