Graphing Trigonometric Functions
Purplemath
You've already learned the basic trig graphs. But just as you could make the basic quadratic, y = x2, more complicated, such as y = −(x + 5)2 − 3, so also trig graphs can be made more complicated. We can transform and translate trig functions, just like you transformed and translated other functions in algebra.
Content Continues Below
Let's start with the basic sine function, f (t) = sin(t). This function has an amplitude of 1 because the graph goes one unit up and one unit down from the midline of the graph. This function has a period of 2π because the sine wave repeats every 2π units.
The graph of f (t) = sin(t) looks like this:

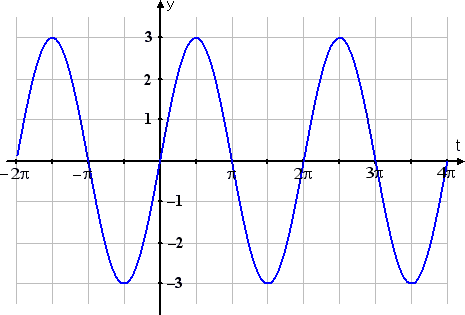
Now let's look at g(t) = 3sin(t):

Do you see that this second graph is three times as tall as was the first graph? The amplitude has changed from 1 in the first graph to 3 in the second, just as the multiplier in front of the sine changed from 1 to 3. This relationship is always true: Whatever number A is multiplied on the trig function gives you the amplitude (that is, the "tallness" or "shortness" of the graph); in this case, that amplitude number was 3.
-
What is the amplitude of y(t) = 0.5cos(t)?
For this function, the value of the amplitude multiplier A is given by 0.5, so the function will have an amplitude of:
amplitude: 0.5 = ½
-
What is the amplitude of y(x) = −2cos(x)?
For this function, the value of the amplitude multiplier A is −2, so the amplitude is:
amplitude: 2
...and, by the way, the graph of y = −2cos(x) would also be flipped upside down, because of the "minus" sign.
Affiliate
Technically, the amplitude is the absolute value of whatever is multiplied on the trig function. The amplitude just says how "tall" or "short" the curve is; it's up to you to notice whether there's a "minus" on that multiplier, and thus whether or not the function is in the usual orientation, or upside-down.
Affiliate
Recall the first graph above, which was the "regular" sine wave:

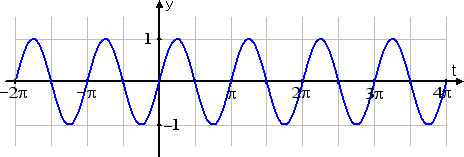
Now let's look at h(t) = sin(2t):

Do you see how this third graph is squished in from the sides, as compared with the first graph? Do you see that the sine wave is cycling twice as fast, so its period is only half as long?
This relationship is always true: Whatever value B is multiplied on the variable (inside the trig function), you use this value to find the period ω ("omega", not "double-u") of the trig function, according to this formula:
general period formula:
For sines and cosines (and their reciprocals, cosecants and secants), the "regular" period is 2π, so their period formula is:
period formula for sines & cosines:
For tangents and cotangents, the "regular" period is π, so their period formula is:
period formula for tangents & cotangents:
In the sine wave graphed above, the value of the period multiplier B was 2. (Sometimes the value of B inside the function will be negative, which is why there are absolute-value bars on the denominator.) As a result, its period was .
Content Continues Below
-
What is the period of f (t) = cos(3t)?
The formula for sines and cosines says that the regular period is 2π. In cos(3t), B = 3, so this function will have a period of:
-
What is the period of ?
The formula for tangents and cotangents says that the regular period is π. For , the value of B is ½, so the function will have a period of:
Recall again the first graph above, being that of the "regular" sine wave:

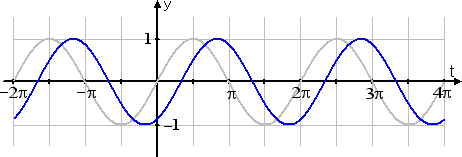
Now let's look at :

Do you see that the graph (shown in blue on the graph above) is shifted over to the right by π/3 units from the regular graph (shown in gray)? This relationship is always true: If the argument of the function (the thing you're plugging in to the function) is of the form "(variable) − C" (where C is just some number), then the graph is shifted to the right by that number of units (that is, by C units); if the argument is of the form "(variable) + C", then the graph is shifted to the left by that number of units (again, by C units). Within the context of trigonometric functions, this right- or left-shifting is called "phase shift".
-
What is the phase shift of ?
Inside the argument (that is, inside the parentheses of the function), a is added to the variable. This means that . Because this value is added to the variable, then the shift is to the left. Then the phase shift is:
to the left by
-
What is the phase shift of
The number C inside with the variable is , so this will be the phase shift. This number is subtracted from the variable, so the shift will be to the right.
to the right by
Let's recollect again the graph of the "regular" sine wave:

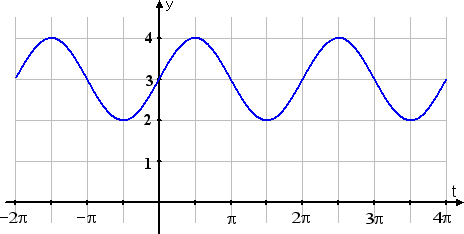
Now let's look at k(t) = sin(t) + 3:

Do you see how the graph was shifted up by three units? This relationship is always true: If a number D is added outside the function, then the graph is shifted up by that number of units; if a number D is subtracted, then the graph is shifted down by that number of units.
-
By what amount is the graph of h(t) = cos(t) − 2 shifted, and in which direction?
The trig-function part is the cos(t); the up-or-down shifting part is the D = −2. There's nothing else going on inside of the function, nor multiplied in front of it, so this is the regular cosine wave, but it's:
shifted downward two units
-
By what amount is the graph of t(x) = tan(x) + 0.6 shifted, and in which direction?
The trig-function part is the tan(x); the up-or-down shifting part is the + 0.6. So this is the regular tangent curve, but:
shifted upward by of a unit
Advertisement
Putting it all together in terms of the sine wave, we have the general sine function:
F(t) = Asin(Bt − C) + D
...where |A| is the amplitude, B gives you the period, D gives you the vertical shift (up or down), and is used to find the phase shift.
Affiliate
"Wait!", I hear you cry; "Why don't we just just use C for the phase shift?" Because sometimes more involved stuff is going on inside the function. Remember that the phase shift comes from what is added or subtracted directly to the variable. If the variable isn't alone (that is, if there's something multiplied directly on it), then there's another step to follow.
For instance, if you have something like:
...the phase shift is not π units! Instead, you first have to isolate what's happening to the variable by factoring, as so:
Now you can see that the phase shift will be units, not π units. So the phase shift, as a formula, is found by dividing C by B.
For F(t) = A f (Bt − C) + D, where f(t) is one of the basic trig functions, we have:
- the amplitude is |A|
- the period is
- the phase shift is
- the vertical shift is D
(Note: Different books use different letters to stand for the period formula. In your class, use whatever your book or instructor uses.)
-
Find the amplitude, period, phase shift, and vertical shift of s(t) = −2.5tan(4t − 3π) − 4
The amplitude is given by the multipler on the trig function. In this case, there's a −2.5 multiplied directly onto the tangent. This is the "A" from the formula, and tells me that the amplitude is 2.5. (If I were to be graphing this, I would need to note that this tangent's graph will be upside-down, too.)
The regular period for tangents is π. In this particular function, there's a 4 multiplied on the variable, so B = 4. Plugging into the period formula, I get .
To find the phase shift, I need to isolate the variable with the shift value, so I need to factor out the 4 (also known as "C") that's multiplied on the variable. The factorization is:
Then the phase shift is . Because the shift value is subtracted from the variable, the shift is to the right.
(I could also have used the simpler method, directly from the formula, of dividing C by B. This would have given me the same value, but more quickly and with less chance of error in the factorization. Try it both ways yourself, and figure out which one you like better. Then practice it well before the next test.)
The vertical shift comes from the value entirely outside of the trig function; namely, the outer 4 (also known as "D", from the formula). Because this 4 is subtracted from the tangent, the shift will be four units downward from the usual center line, the x-axis.
amplitude: 2.5
period:
phase shift: to the right by
vertical shift: downward by 4
So far, we've looked at finding the information needed for graphing. Now let's see what this process looks like in practice, because there's a way to make drawing these graphs a whole lot easier than what they show in the book....
URL: https://www.purplemath.com/modules/grphtrig.htm
Select a Course Below
Standardized Test Prep
Homeschool Math
© 2024 Purplemath, Inc. All right reserved. Web Design by ![]()


