Graphing Quadratics: More Examples
Purplemath
To find the y-intercept of a graph, you plug zero in for x, and simplify. Because this is a very easy thing to do (evaluating at zero), many graphing exercises won't ask you explicitly to find this value.
However, because it is so easy, you might as well find this intercept anyway. If nothing else, it'll help make sure that your graph is accurate.
Content Continues Below
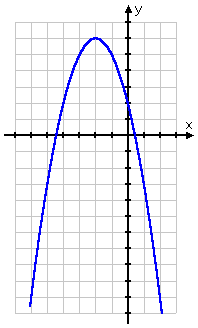
- Find the x-intercepts and vertex of y = −x2 − 4x + 2, and graph.
Since it is so simple to find the y-intercept (and it will probably be a point in my T-chart anyway), they are only asking for the x-intercepts this time. To find the x-intercept, I set y equal 0 and solve:
0 = −x2 − 4x + 2
x2 + 4x − 2 = 0
Affiliate
(How did I get these values? By applying the Quadratic Formula. It's perfectly okay to have messy intercepts.)
For graphing purposes, these x-intercepts are at about (−4.4, 0) and (0.4, 0). (When I write down the answer, I will of course use the "exact" form, complete with the square roots; I use my calculator's decimal approximations only for helping me graph.)
The y-intercept occurs where x = 0:
y = −(0)2 − 4(0) + 2 = 2
To find the vertex, I look at the coefficients: a = −1 and b = −4. Plugging these into the formula for h (that is, the formula for the first coordinate of the vertex), I get:
To find the value of k (that is, of the second coordinate of the vertex), I plug h = −2 in for x in y = −x2 − 4x + 2, and simplify:
Now I'll find some additional plot points, to help me fill in my graph:
Note that I picked x-values that were centered around the x-coordinate of the vertex. Doing so assured me of finding at least some usefully graphable points. Now, with my T-chart and intercepts, I can plot the parabola:

The rest of my answer consists of the vertex and the intercepts:
vertex: (−2, 6)
intercepts: (0, 2), , and
Content Continues Below
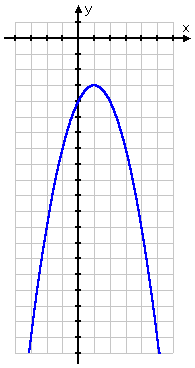
- Find the intercepts and vertex of y = −x2 + 2x − 4, and graph the parabola.
To find the vertex, I look at the coefficients: a = −1 and b = 2. Then I plug these into the formula for the first coordinate of the vertex:
To find k (the second coordinate of the vertex), I'll plug h in for x in the quadratic, and simplify:
The vertex is below the x-axis, and, since this is a negative quadratic, I know that the associated parabola is going to graph as upside-down. So can my graph possibly cross the x-axis? Can there possibly be any x-intercepts? Of course not!
So I expect to get "no (real) solution" when I try to find the x-intercepts, but I need to show my work anyway. To find the x-intercepts, I set y equal to 0 and solve:
0 = −x2 + 2x − 4
x2 − 2x + 4 = 0
As soon as I get a negative inside the square root, I know that I can't get a graphable solution. So, as expected, there are no x-intercepts.
Now I'll find some additional plot points to fill in my graph. I'll pick x-values that are centered on the vertex' x-value of 1:
Note that, as a result of my picking x-values that were centered around the x-coordinate of the vertex, I gave myself a nice spread of points to graph. Now I can plot the parabola:

The rest of my answer is the vertex and the only intercept (being the y-intercept):
vertex: (1, −3)
intercept: (0, −4).
This last exercise illustrates one way you can cut down a bit on your work. If you solve for the vertex first, then you can easily tell if you need to continue on and look for the x-intercepts, or if you can go straight on to plotting some points and drawing the graph. If the vertex is below the x-axis (that is, if the y-value is negative) and the quadratic is negative (so the parabola opens downward), then there will be no x-intercepts. Similarly, if the vertex is above the x-axis (that is, if the y-value is positive) and the quadratic is positive (so the parabola opens upward), then there will be no x-intercepts.
Affiliate
Advertisement
Another advantage of finding the vertex first is that this tells you where the "middle" of the parabola is (that is, where the axis of symmetry is located). So if, for instance, you find that a particular quadratic's parabola has its axis of symmetry at h = −8, you would know to pick T-chart x-values between, say, −15 and zero. You would know that trying x-values like 7 would be unhelpful.
In most of the graphs that I did (though not the first one), it just so happened that the points on the T-chart were symmetric about the vertex; that is, that the points "matched" on either side of the vertex. While a parabola is always symmetric about the vertical line through the vertex (the parabola's "axis"), the T-chart points might not be symmetric. In particular, the T-chart points will not "match" if the x-coordinate of the vertex is something other than a whole number or a half-number (such as "3.5"). Don't expect the plot-points always to "match up" on either side of the vertex; in particular, don't do half the points on your T-chart and then "fill in" the rest of your T-chart by assuming a symmetry that might not exist.
Other tips for graphing: If the parabola is going to be "skinny", then expect that you will get some very large values in your T-chart. You will either end up with a really tall graph or else a rather short T-chart. If the parabola is going to be "fat", then expect that you will probably have to plot points with fractions as coordinates. In either case, when you go to connect the dots to draw the parabola, you might find it helpful to turn the paper sideways and first draw the really curvy part through the vertex, making sure that it looks nice and round. Then turn the paper back right-side-up and draw the "sides" of the parabola.
Warning: Draw your graphs big enough to be clearly seen by your instructor. If you're fitting more than two or maybe three graphs on one side of a standard sheet of paper, then you're drawing your graphs way too small.
URL: https://www.purplemath.com/modules/grphquad4.htm
Select a Course Below
Standardized Test Prep
Homeschool Math
© 2024 Purplemath, Inc. All right reserved. Web Design by ![]()


