Graphing Quadratics: Worked Examples
Purplemath
As with any other pursuit, one gains proficiency in graphing quadratics by practicing. So, besides studying the worked examples on this and the next page, please allow yourself the time to do plenty of practice exercises from your textbook.
Content Continues Below
Even if an exercise doesn't specifically ask for the intercepts or the vertex, you may find it to be in your own best interest to compute these points anyway, because they will help you draw an accurate graph.
And I've never heard of an instructor complaining about a student providing "too complete" an answer. 😉
Advertisement
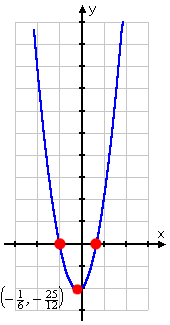
- Find the vertex and intercepts of y = 3x2 + x − 2 and graph; on your graph, label the vertex and the axis of symmetry.
This is the same quadratic as in the last example on the previous page. I already found the vertex; it's the point .
For this exercise, I also need to find the intercepts before I do my graph. To find the y-intercept, I set x equal to zero and solve:
y = 3(0)2 + (0) − 2
= 0 + 0 − 2 = −2
Then the y-intercept is the point (0, −2). To find the x-intercept, I set y equal to zero, and solve:
0 = 3x2 + x − 2
0 = (3x − 2)(x + 1)
3x − 2 = 0 or x + 1 = 0
or x = − 1
Then the x-intercepts are at the points (−1, 0) and .
The axis of symmetry is halfway between the two x-intercepts at (−1, 0) and at ; using this fact, I can confirm the value of h from the vertex that I found on the previous page:
My complete answer is a listing of the vertex, the axis of symmetry, and all three intercepts, along with a nice neat graph:

vertex:
axis of symmetry:
intercepts: (0, −2), (−1, 0), and
Content Continues Below
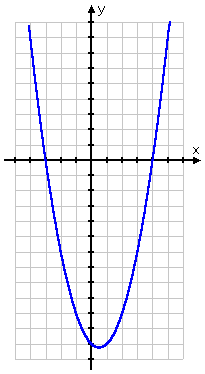
- Find the intercepts, the axis of symmetry, and vertex of y = x2 − x − 12, and graph.
To find the y-intercept, I set x equal to 0 and solve:
y = (0)2 − (0) − 12
= 0 − 0 − 12 = −12
To find the x-intercept, I set y equal to 0 and solve:
0 = x2 − x − 12
0 = (x − 4)(x + 3)
x = 4 or x = −3
To find the vertex, I look at the coefficients: a = 1 and b = −1. Plugging into the formula , I get:
To find k, I plug in for x in y = x2 − x − 12, and simplify:
Once I have the vertex, it's easy to write down the axis of symmetry; it's the vertical line through the vertex: x = 0.5.
Now I'll find some additional plot points, to fill in the graph:
For my own convenience, I picked x-values that were centered around the x-coordinate of the vertex. Now I can plot the parabola:

vertex: (0.5, −12.25)
axis of symmetry: x = 0.5
intercepts: (0, −12), (−3, 0), and (4, 0).
URL: https://www.purplemath.com/modules/grphquad3.htm
Select a Course Below
Standardized Test Prep
Homeschool Math
© 2024 Purplemath, Inc. All right reserved. Web Design by ![]()


