More Examples of Graphing Exponential Functions
Purplemath
Nearly all exponential graphs that you'll see in science classes and word problems will be of the standard-curve type. But you should expect to see some exponentials whose graphs are decidedly different.
Content Continues Below
Regardless of the base, the steps for graphing will remain the same: plot enough points that you have a good idea of the shape of the graph, and expect to see some really big and some really small values; draw neat axes; and graph clearly.
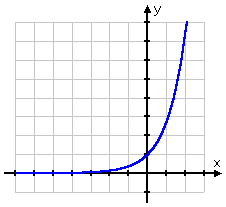
- Graph y = ex
Affiliate
The base e is the natural exponential, being the number approximately equal to 2.718. Because the base here is not a nice neat whole number, this might feel like it's going to be a bit more difficult to graph, because just about all of my y-values will be decimal approximations.
But if I round off these approximations to a reasonable number of decimal places (one or two is generally fine for the purposes of graphing), then this graph will be fairly easy. I just need to make sure that I've drawn a nice neat graph with a consistent scale on my axes.
I am careful to include in my T-chart both the exact y-values and the decimal approximations, for completeness. My graph is:
Content Continues Below
If the power in an exponential isn't a linear variable expression (such as −x or x + 2), but is instead a quadratic (such as 2x2) or something else, then the graph may look different. As in, very different.
Also, if there is more than one exponential term in the function, the graph may have an unexpected shape.
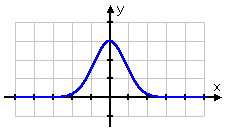
- Graph y = 3×2−x2
Because the power here is a negative quadratic, the power will always be negative (or zero). Then this graph should mostly be pretty close to the x-axis. (The graph may behave differently close to x = 0.)
From my T-chart, I can see that there are very few points that are reasonable to graph; instead, the values confirm that this graph will be hugging the x-axis on the left and on the right. Anything interesting on the graph will occcur in the middle, near the origin.
I'll join the points I've got, and I'll make sure to remember to draw the rest of the graph as a curvy line (rather than as a series of straight-line segments). Here's my graph:
Affiliate
You may (later) encounter what are called "hyperbolic functions". Until calculus (or at least trigonometry), you won't likely actually do anything with these funtions. However, you should not be surprised to see a hyperbolic function during this graphing section of your studies.
(I think they're trying to prep you for hyperbolic functions but, being honest, you're unlikely to remember them by the time you get to calculus. For now, just use your calculator to get your decimal approximations, and draw a neat graph.)
- Graph the following:
This is actually a useful function called the hyperbolic sine. To graph this, I compute points and plot, as usual — almost. Since the expression is lumpy and large, I'll just record the decimal approximations in my T-chart:
The T-chart's values show that the graph will shoot up on the right and down on the left (sort of like a cubic polynomial), so my graph will be taller than wide. I won't bother graphing the points for x = −4 and x = 4.
Here's my graph:
![Graph for y = [ e^x - e^(-x) ] / 2](logs/grphex24.gif)
Advertisement
Sometimes you will see the more-complicated exponential functions like the ones above. At this stage in your mathematical career, though, you will probably mostly be dealing with the standard exponential form. So make sure that you're comfortable with its general shape and behavior.
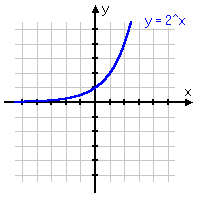
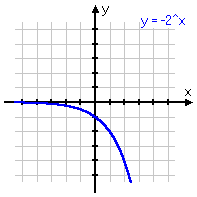
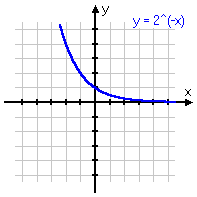
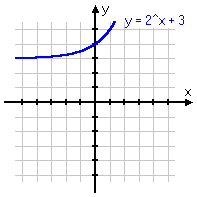
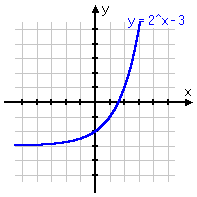
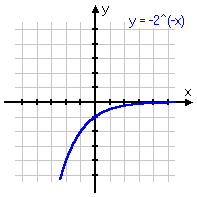
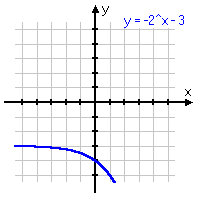
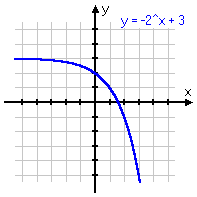
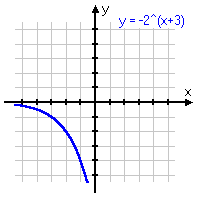
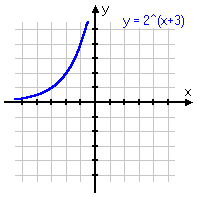
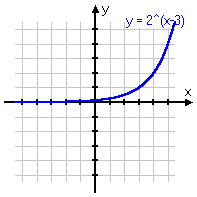
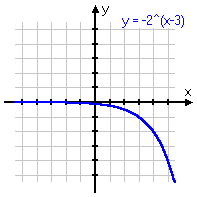
To review: below are some different variations on the same basic exponential function, with the associated graph below each equation. Note that, even if the graph is moved left or right, or up or down, or is flipped upside-down, it still displays the same shape of curve. Make sure you are familiar with this shape!
y = 2x
y = −2x
y = 2−x
y = 2x + 3
y = 2x − 3
y = −2−x
y = −2x − 3
y = −2x + 3
y = −2x+3
y = 2x+3
y = 2x−3
y = −2x−3
URL: https://www.purplemath.com/modules/graphexp4.htm
Select a Course Below
Standardized Test Prep
Homeschool Math
© 2024 Purplemath, Inc. All right reserved. Web Design by ![]()


