Graphing Exponential Functions By Hand
Purplemath
How do you graph an exponential function by hand?
To graph an exponential function by hand, you need to find the intercept(s), plot a few additional points, and then connect the dots and draw the graph, using what you know of exponential behavior and the general shape of the curve.
Content Continues Below
Remember that one side of an original exponential function will be a nearly horizontal line, while the other side will shoot upwards (or downwards) very quickly.
- Graph y = 3x
Since 3x grows so quickly, I will not be able to find many reasonably-graphable points on the right-hand side of the graph. And 3x will very quickly get very small on the left-hand side of the graph, so I probably won't find many useful plot-points there, either.
Instead, I will find a few plot-points in the middle, close to the origin, and then draw the graph from there.
Here is my T-chart:
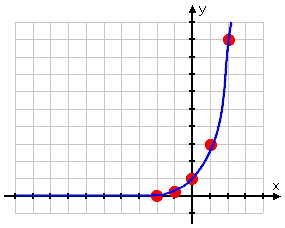
While I have seven plot-points in my T-chart, only as many as five are reasonable to plot. So I plot them:
Plotted points:
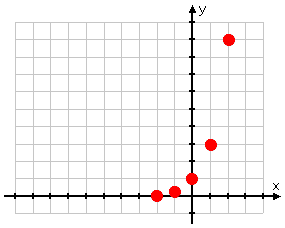
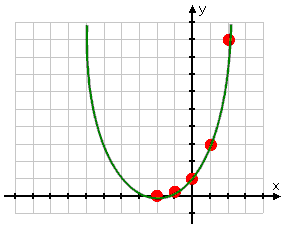
I'd better not try to continue the line as a quadratic:
THIS GRAPH IS WRONG!
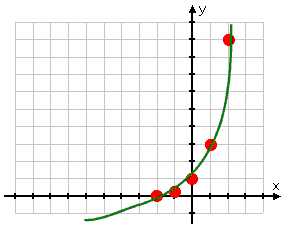
...or as a straight-ish or only vaguely curved line:
THIS GRAPH IS ALSO WRONG!
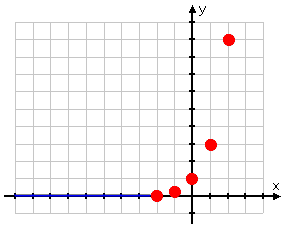
The exponential, remember, will get (and stay) very close to zero on the left-hand side, so I will draw the graph "skinnying along" the top of the x-axis on the left-hand side:
Drawing the left-hand side
And on the right-hand side, the exponential will get really big, so I'll draw it shooting up through the top of my graph:
Drawing the right-hand side
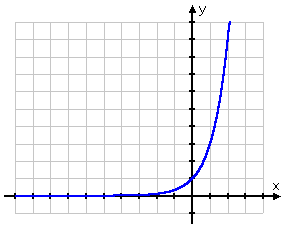
Then my graph for this exponential is:
Graph of y = 32
URL: https://www.purplemath.com/modules/graphexp2.htm
Select a Course Below
Standardized Test Prep
Homeschool Math
© 2024 Purplemath, Inc. All right reserved. Web Design by ![]()


