Exponential Functions: Evaluation & Graphing
Purplemath
The first step in becoming familiar with exponential functions is evaluating them. You'll be given an exponential expression or function, and an input value; you'll plug that value into the given rule, and you'll simplify to get the value they want. If they give you a list of values at which to evaluate an exponential, then your answer will essentially be a T-chart.
Content Continues Below
What is an example of evaluating an exponential?
- Evaluate 3x at x = −2, −1, 0, 1, and 2.
To find the answer they're wanting, I need to plug the given values for x into the exponential expression 3x, and simplify to get the numerical value. Since they've given me a list of input values, I'll use a T-chart to hold my answer.
The example above involved plugging x-values into an expression. You'll most often be plugging x-values into the rule for a function or equation. This next example shows how this works.
- Given f (x) = 3−x, evaluate f (−2), f (−1), f (0), f (1), and f (2).
To find the answer, I need to plug in the given values for x, and simplify:
In this T-chart, the outputs went from large to small. Why? Because the power had a "minus" sign on it. This effectively reversed the input values, so it flipped the outputs, too. This type of exponential, where things are decreasing, is called "exponential decay". In exponential decay, the function has a halving-period, being a regular input length over which the output values get cut in half.
Content Continues Below
Take another look at the values I came up with in the two T-charts above: they were precisely reversed between the two T-charts. Remember that negative exponents mean that you have to flip the base to the other side of the fraction line. This means that 3−x may also be written as , by taking the "minus" in the exponent and using it to flip the base 3.
With this in mind, you should be able to predict the values for the following problem:
- Given , evaluate for x = −2, −1, 0, 1, and 2.
I'll plug in the given values for x, and simplify:
Affiliate
These three T-charts, taken together, point out two things. First, you really do need to be good with exponents in order to do exponentials (so review the topic, if necessary); and, second, exponential decay (getting smaller and smaller by half (or a third, or...) at each step) is just like exponential growth, except that either the exponent is negative (for example, the −x in 3−x) or else the base is between 0 and 1 (for example, the in ).
It will likely be necessary for you to be able to just look at an equation or an expression or a graph and correctly identify which type of change it represents, growth or decay, so go back and study the above examples, if you're not sure of what is going on here.
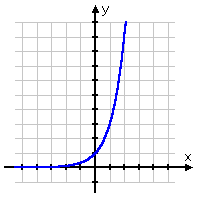
To be thorough, since 3x models growth:

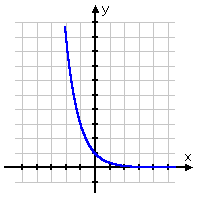
...and since 3−x and model decay:

...it seems reasonable that (small base and a negative exponent) should model growth. Let's check...
- Graph
I will compute the same points as previously:
Then the graph is:

So does indeed model growth.
For the record, however, the base for exponential functions is usually greater than 1, so growth is usually in the form 3x (that is, growth models usually have a base larger than 1, and have a positive exponent) and decay is usually in the form 2−y (that is, decay models usually have a base larger than 1, and have a negative exponent).
(Click to see a variety of versions of the same graph, to see the similarity of shape. You may be expected to be able to recognize this shape.)
URL: https://www.purplemath.com/modules/expofcns2.htm
Select a Course Below
Standardized Test Prep
Homeschool Math
© 2024 Purplemath, Inc. All right reserved. Web Design by ![]()


