Solving Polynomial Inequalities
Purplemath
On the previous page, we covered three methods for solving quadratic inequalities: the Test Point Method, the Factor Method, and the Parabola Method. We settled on the Parabola Method, because it's easy to picture parabolas in our heads, which makes it simple to pick the solution intervals for the inequalities.
Content Continues Below
However, the Factor Method *is* powerful and, while it's overkill for two-factor quadratics, it can be incredibly useful for many-factored polynomial inequalities.
How do you solve polynomial inequalities?
To solve polynomial inequalities, follow these steps:
- Move terms, if necessary, in order to get the polynomial isolated on one side of the inequality symbol, with zero on the other side.
- Factor the polynomial completely. Use the factors to find the zeroes of the polynomial.
- Use the polynomial's zeroes to split the number line into intervals.
- Find the solution intervals by using the Test Point Method or the Factor Method.
Affiliate
The Test Point Method is just what it sounds like: you pick a point in a given interval, plug that point into the polynomial, and use the resulting value to test if that interval is part of the solution for the polynomial inequality. But, especially for polynomials with lots of terms, the Test Point Method is prone to errors; it's easy to make a simple arithemetical mistake that gives you an incorrect result.
The Factor Method, on the other hand, just uses the factors (that you've already found) and their signs (which involves nothing more than solving simple inequalities). Then you count the "minus" signs. That's it.
- Solve x5 + 3x4 − 23x3 − 51x2 + 94x + 120 ≥ 0
This polynomial is already isolated on the left-hand side of the inequality, so that step is done.
Now, I factor the polynomial to find all of its zeroes:
x5 + 3x4 − 23x3 − 51x2 + 94x + 120
(x + 5)(x + 3)(x + 1)(x − 2)(x − 4)
Setting each factor equal to zero and solving, I get the polynomial's zeroes as being:
x = −5, −3, −1, 2, 4
(Review how to solve polynomials, if you're not sure how to get this result.)
These zeroes split the number line into the following intervals:
(−∞, −5], [−5, −3], [−3, −1], [−1, 2], [2, 4], [4, +∞)
(The intervals have square brackets at their numerical endpoints because this is an "or equal to" inequality.)
To solve by the Test-Point Method, I would pick a sample point in each interval. As you can see, if your polynomial or rational function has many factors, the Test-Point Method can become quite time-consuming, multiplying the opportunities for error.
On the other hand, to solve by the Factor Method, I solve each factor for its positivity:
x + 5 > 0 ⇒ x > −5
x + 3 > 0 ⇒ x > −3
x + 1 > 0 ⇒ x > −1
x − 2 > 0 ⇒ x > 2
x − 4 > 0 ⇒ x > 4
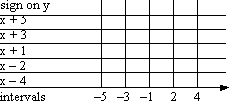
Then I draw my grid, where the rows are the factors, the vertical lines mark the zeroes that split the number line into intervals, the boxes formed by these lines will contain the signs of the factors on each interval, and the top row will contain the signs on the intervals for the entire polynomial:
For each factor, I put a "plus" sign in each box where that factor is greater than zero; then I put "minus" signs in all the rest of that row's boxes:
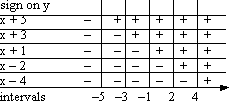
Now I apply the power of the Factor Method.
Affiliate
Advertisement
The polynomial is the product of all of its factors. On each interval, the sign of the polynomial is the product of the signs of its factors. And I can find the sign of the product by counting up "minus" signs. If there are an odd number of "minus" signs (that is, if there are an odd number of negative factors) on that interval, then the sign on the polynomial on that interval is "minus"; if there are an even number of "minus" signs, then they cancel each other out and the polynomial is "plus" on that interval. I put the sign of the product of the factor-signs up in that top row.
So, looking at the column for the first interval in the table above, (−∞, −5], I see that there are five "minus" signs. The product of five "minus" signs is "minus", so I put a "minus" at the top of that column (below). This tells me that the complete polynomial is negative on this interval.
In the second column, representing the interval [−5, −3], there are four "minus" signs (above), which multiply to "plus". So I put a "plus" sign at the top of this column (below), telling me that the polynomial is positive on this interval.
And so forth, for the other intervals. My result is shown below:
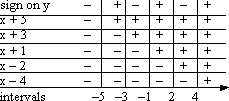
Checking back on the original inequality, I see that I'm supposed to find where the polynomial is greater than or equal to zero, so I'll be picking the intervals with a "plus" sign at the top of an interval's column, and I'll need to remember to include the endpoints.
So my answer is:
[−5, −3], [−1, 2], [4, +∞)
As you can see, if your polynomial or rational function has many factors, the Factor Method can be much faster and more reliable than slogging away at the Test Point Method.
Content Continues Below
- Solve −x7 + 8x6 − 5x5 − 92x4 + 285x3 −528x2 + 873x −540 ≥ 0
The factored form of the above polynomial is:
(x + 4)(5 − x)(x − 1)(x − 3)2(x2 + 3)
Now I need to find where each factor is greater than zero.
x + 4 > 0 ⇒ x > −4
5 − x > 0 ⇒ x < 5
x − 1 > 0 ⇒ x > 1
x − 3 > 0 ⇒ x > 3
x − 3 > 0 ⇒ x > 3
x2 + 3 > 0 ⇒ for all x
In the second inequality above, note that the "greater than" became a "less than". You should expect "backwards" factors like this to change your interval signs in the opposite way from the usual.
In the last line above, I said that x2 + 3 is always positive. I can tell, because this factor is a square (so, non-negative) added to a positive number; this factor must always be positive. I will get no x-intercepts from this factor.
In the two lines right above the line with the factor containing the square, I've solved the same factor twice. This is becasue it is included twice in the polynomial's factorization, and I'll want to remember to include both copies of this factor in my chart.
Checking the original exercise, I see that they're wanting the intervals where the polynomial is positive, and that I'll need to include the endpoints. So my answer is:
(−∞, −4], [1, 5]
You might be wondering how I got an interval of [1, 5], instead of [1, 3] and [3, 5]. Had this inequality been strict, so "or equal to zero" would not be included, then there would indeed have been a break, because 3 would not be included. But because this inequality includes zeroes, there is no gap or break between the two intervals. Therefore they become one.
There is another way to solve polyomial inequalities. You still have to find the zeroes (x-intercepts) first, but then you graph the function, and just look: wherever the graph is above the x-axis, the function is positive; wherever it is below the axis, the function is negative. For instance, for the first quadratic exercise, y = x2 − 3x + 2 > 0, we found the zeroes at x = 1 and x = 2. Now look at the graph:
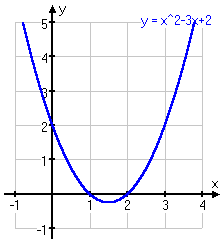
On the graph, the solution is obvious: you would take the two intervals (but not the interval endpoints) where the line is above the x-axis.
Or that huge polynomial we did at the top of this page: x5 + 3x4 − 23x3 − 51x2 + 94x + 120 ≥ 0. We found the zeroes of the polynomial, being x = −5, x = −3, x = −1, x = 2, and x = 4. Now look at the graph:
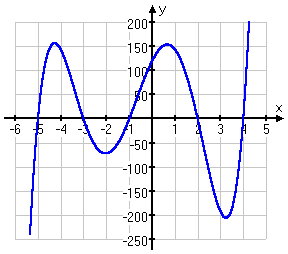
On the picture, the solution is obvious: take the three intervals (together with the interval endpoints) where the line is above the x-axis.
The graph for the second polynomial confirms our solution, too:
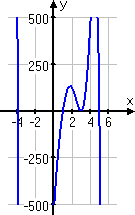
Any time you have a factor which is repeated an even number of times, you will have a spot on the graph where the line bounces off the axis, as you can see above at x = 3.
As you can probably guess, a graphing calculator can save you a lot of time on these inequalities — if you understand what you're doing. You should still show your work and reasoning, but don't be shy about using the pictures to confirm the algebra.
URL: https://www.purplemath.com/modules/ineqsolv3.htm
You can use the Mathway widget below to practice solving polynomial inequalities. Try the entered exercise, or type in your own exercise. Then click the button and select "Solve the inequality for x" to compare your answer to Mathway's. (You can also enter the original polynomial and ask the widget to check your factorization, or set the polynomial equal to y and ask it to provide you with the graph.)
Please accept "preferences" cookies in order to enable this widget.
(Click "Tap to view steps" to be taken directly to the Mathway site for a paid upgrade.)
Select a Course Below
Standardized Test Prep
Homeschool Math
© 2024 Purplemath, Inc. All right reserved. Web Design by ![]()


