Stem-and-Leaf Plots: Examples
Purplemath
The following examples provide some practice with stem-and-leaf plots, as well as explaining some details of formatting, and showing how to create a "key" for your plot.
-
Subjects in a psychological study were timed while completing a certain task. Complete a stem-and-leaf plot for the following list of times:
7.6, 8.1, 9.2, 6.8, 5.9, 6.2, 6.1, 5.8, 7.3, 8.1, 8.8, 7.4, 7.7, 8.2
Content Continues Below
The first thing I'll do is reorder this list. It isn't required, but it surely makes life easier. My ordered list is:
5.8, 5.9, 6.1, 6.2, 6.8, 7.3, 7.4, 7.6, 7.7, 8.1, 8.1, 8.2, 8.8, 9.2
These values have one decimal place, but the stem-and-leaf plot makes no accomodation for this. The stem-and-leaf plot only looks at the last digit (for the leaves) and all the digits before (for the stem). So I'll have to put a "key" or "legend" on this plot to show what I mean by the numbers in this plot. The ones digits will be the stem values, and the tenths will be the leaves.
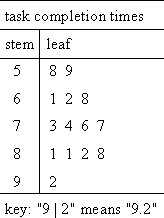
Properly, every stem-and-leaf plot should have a key. But many don't, and your class might not cover this. If it doesn't come up in your textbook or in the lecture, you can probably ignore this issue.
Content Continues Below
-
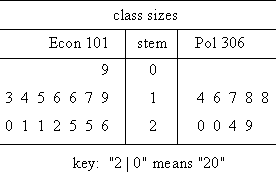
Complete a stem-and-leaf plot for the following two lists of class sizes:
Economics 101: 9, 13, 14, 15, 16, 16, 17, 19, 20, 21, 21, 22, 25, 25, 26
Libertarianism: 14, 16, 17, 18, 18, 20, 20, 24, 29
This example has two lists of values. Since the values are similar, I can plot them all on one stem-and-leaf plot by drawing leaves on either side of the stem I will use the tens digits as the stem values, and the ones digits as the leaves. Since "9" (in the Econ 101 list) has no tens digit, the stem value will be "0".
-
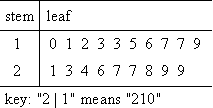
Complete a stem-and-leaf plot for the following list of values:
100, 110, 120, 130, 130, 150, 160, 170, 170, 190, 210, 230, 240, 260, 270, 270, 280, 290, 290
Since all the ones digits are zeroes, I'll do this plot with the hundreds digits being the stem values and the tens digits being the leaves. I can do the plot like this:
Affiliate
But the leaves are fairly long this way, because the values are so close together. To spread the values out a bit, I can break each leaf into two. For instance, the leaf for the two-hundreds class can be split into two classes, being the numbers between 200 and 240 and the numbers between 250 and 290. I can also reverse the order, so the smaller values are at the bottom of the "stem". The new plot looks like this:
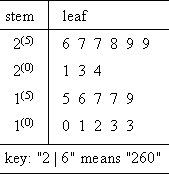
In the above example, I split the sets of ten into sets of five; each original leaf became two classes. For very compact data points, you can even split the leaves into five classes, like this:
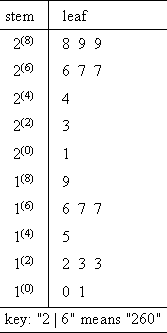
How you split the data into categories will vary with the data you've got, as well as (to a certain extent) personal taste. Mostly, you're aiming to come off as being "reasonable" in your classes.
-
Complete a stem-and-leaf plot for the following list of values:
23.25, 24.13, 24.76, 24.81, 24.98, 25.31, 25.57, 25.89, 26.28, 26.34, 27.09
Affiliate
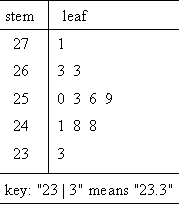
If I try to use the last digit, the hundredths digit, for these numbers, the stem-and-leaf plot will be enormously long, because these values are so spread out. (With the numbers' first three digits ranging from 232 to 270, I'd have thirty-nine leaves, most of which would be empty.) So instead of working with the given numbers, I'll round each of the numbers to the nearest tenth, and then use those new values for my plot. Rounding gives me the following list:
23.3, 24.1, 24.8, 24.8, 25.0, 25.3, 25.6, 25.9, 26.3, 26.3, 27.1
Then my plot looks like this:
Affiliate
In the last example above, some data was lost, due to my having rounded. Sometimes you have to make that sort of judgement call.
And, of course, when you're drawing a stem-and-leaf plot, you should always use a ruler to construct a neat table, and you should label everything clearly. The following examples provide some practice with stem-and-leaf plots, as well as explaining some details of formatting, and showing how to create a "key" for your plot.
URL: https://www.purplemath.com/modules/stemleaf2.htm
Select a Course Below
Standardized Test Prep
Homeschool Math
© 2024 Purplemath, Inc. All right reserved. Web Design by ![]()


