Graphing with Slope and y-Intercept
Purplemath
We now know that, given a line equation in the form y = mx + b (if the values of m and b are reasonably "nice"), we can quickly and easily do the graph by starting with the y-intercept at b on the y-axis, and then counting "up and over" to the next point by using the slope. So, for these next graphs, let's not do any other "computations"; let's just work straight from the equation.
-
Graph the equation from the slope and the y-intercept.
Content Continues Below
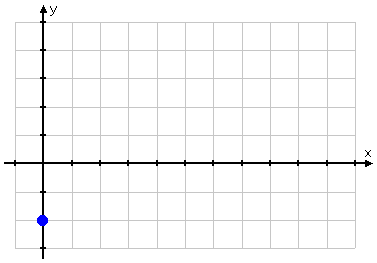
This equation is in slope-intercept form. This means that the line is going to cross the y-axis at y = −2. I'll start by plotting this first point:
The equation also tells me that the slope is . This tells me that, to get from the intercept to the next easy point, I must go "up three and over five". So I do the counting and plot the next point:
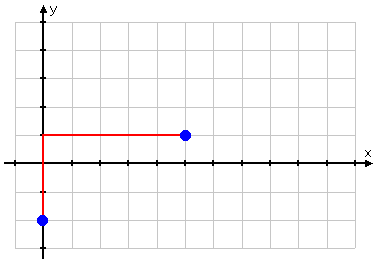
Continuing in the same direction (that is, continuing to work backwards), I go up another three and back another five to get my third point:
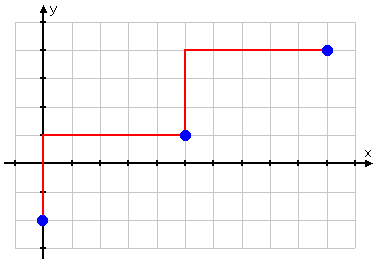
With three points, I can draw my line:
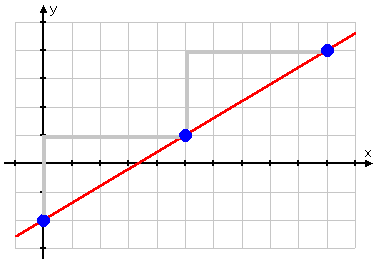
And this graph is the "answer" they're wanting.
Content Continues Below
What if the equation isn't provided in slope-intercept form? In my experience, it's usually simplest to go to the trouble of solving first for "y=", because then everything else will be so much easier.
-
Graph 4x + 3y + 18 = 0
First, I'll solve this equation for "y=":
So I know that the line will cross the y-axis at y = −6, so I'll start plotting there:
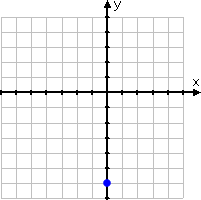
The slope, , which means that I will be moving "down four and over three". But... hmm...
The point I've already got is really far down in my graphing window. It would be easier to plot the point before the intercept, rather than the point after (which is further down). So, instead of going "down four and over three", I'll back up, and go "back three and up four":
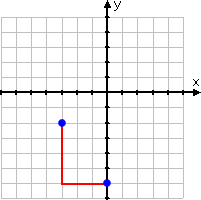
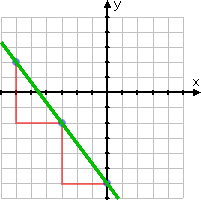
I'll do another point the same way, and then draw my line:
Affiliate
Affiliate
Sometimes, they'll give you an equation where the intercept isn't all that helpful. But you can still do the graphing.
-
Graph 3x − 4y + 5 = 0
First, I'll solve for "y=":
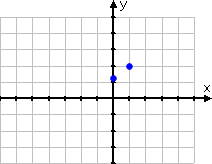
So the line is going to cross the y-axis at . In mixed-number form (surprise! it's still useful!), this is "one, plus one-fourth", so I'll draw my dot one-fourth of the way up from y = 1 to y = 2:
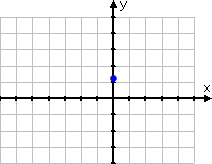
But doing the other points for this graph may be a bit messy, especially if I start my counting from this intercept. I mean, yes, I can go "up three and over four", but that "one-fourth" could be bothersome. Instead, I'll find one nice, neat point, and work from there. First, I'll rearrange the equation like this:
To get that one-fourth to cancel off, I need the parenthetical to be a multiple of 4. After fiddling around on scratch-paper for a bit, I figure out that x = 1 will work:
I started with a nice integer value for x, and I got a nice integer value for y. I'll draw in my dot at (1, 2):
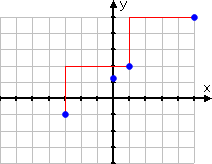
Now I can apply the slope info and do "up three and over four" (or "back four and down three") to find a couple more points:
And now I can draw my line:
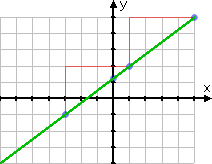
By the way, if you're not wanting to spend the time to find a "nice" input (such as the x = 1 that I found above), you can still do the graph. Just take the time to be very neat, and don't lose track of the messy fractional part.
URL: https://www.purplemath.com/modules/slopgrph2.htm
Select a Course Below
Standardized Test Prep
Homeschool Math
© 2024 Purplemath, Inc. All right reserved. Web Design by ![]()


