Quickie Graphing of Polynomials
Purplemath
Once you know the basic behavior of polynomial graphs, you can use this knowledge to quickly sketch rough graphs. Of course, if you've got a graphing calculator, this isn't very necessary. However, instructors can figure out clever ways of testing your knowledge without a calculator, so it probably wouldn't hurt to be able to do quick graphs without so-called "technology".
This ability to understand the basics of polynomial graphing can save you the trouble of, say, trying to plot a zillion points for a degree-seven polynomial; or of plotting lots of points to figure out what's happening on either side of an x-intercept.
In the former instance, once the graph starts heading off to infinity, you know that the graph is going to keep going, so you can just draw the line heading off the top or bottom of the graph; you don't need to plot a bunch of actual points.
Content Continues Below
In the latter instance, if the intercept is of, say, multiplicity 2, you know that the graph "bounces" at the axis, and then heads off the same way it came. So you can draw a dot at the intercept, and then sketch in the portion of the graph which is right around that intercept, showing the curve bouncing off the axis.
Let's see what this all looks like in practice. Let's imagine that your instructor gives the next test in two parts, and the first part is "no calculators" (and no smart-phones). Here's how you'd do a graphing exercise:
-
Without plotting any points other than the intercepts, draw a graph of the following polynomial:
y = − (x + 5)2 (x + 1)(x − 4)3 (x − 7)
This polynomial has already been put into factored form, which saves me the trouble of doing the solving for the zeroes. I'll just solve the factors, noting the multiplicities as I go. The zeroes will be:
x = −5, with multiplicity 2 (so the graph will be just touching the x-axis here)
x = −1, with multiplicity 1 (so the graph will be crossing the axis here)
x = 4, with multiplicity 3 (so the graph will be crossing the axis here, but also flexing)
x = 7, with multiplicity 1 (so the graph will be just crossing the axis here)
Affiliate
Also, by adding up the degrees of the various factors, I can see that this is a polynomial of degree seven (in particular, it is of odd degree), so the ends will head off in opposite directions. Because the leading coefficient is negative, the left-hand end will be "up" (coming down from the top of the graph) and the right-hand end will go "down" (heading off the bottom of the graph). So I can start my graph by pencilling in the zeroes, the behavior near the zeroes, and the behavior on the ends. First, the easiest part: the zeroes of the polynomial:
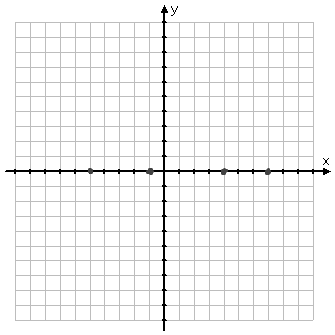
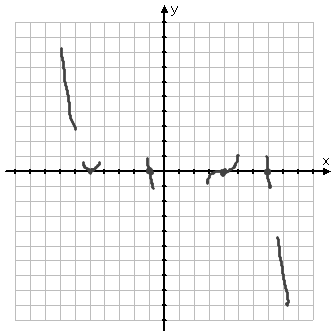
Next, I'll start filling in info, based on multiplicities and end-behavior, starting from the left and working my way across the graphing area.
Content Continues Below
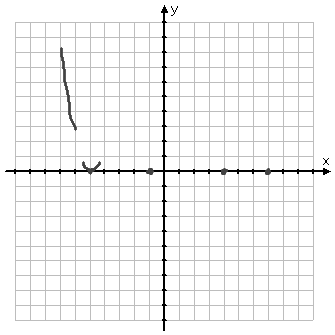
From the multiplicity, I know that the graph just kisses the x-axis at x = −5, going back the way it came. From the degree and sign of the polynomial, I know that the graph will enter my graphing area from above, coming down to the x-axis. So I know that the graph touches the x-axis at x = −5 from above, and then turns back up. So (below) I've drawn a portion of a line coming down toward the axis from above, and I've drawn a curve through the intercept, showing the behavior of the graph there.
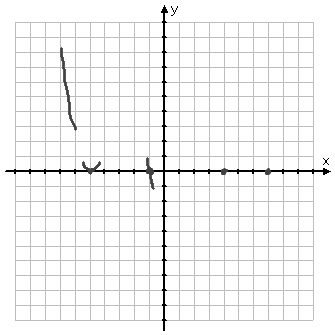
The next x-intercept is at x = −1 and has multiplicity 1, so the graph passes right through the axis here. Because the graph went up from the previous x-intercept, then the graph is coming back down for this intercept. So (below) I've drawn a portion of a line passing downward through this point.
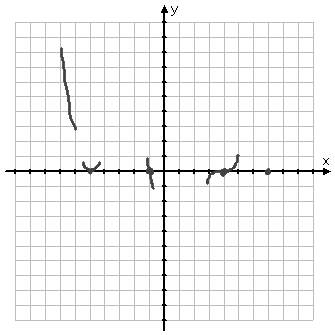
The next x-intercept is at x = 4, with multiplicity 3. Because the multiplicity is odd, I know that the graph will pass through the axis at this point. Because the multiplicity is greater than 1, I know that the graph will flatten a bit at this point, flexing as it passes through the axis. Because the graph went down after the previous intercept, I know that the graph must be coming upward for this intercept. So (below) I've drawn in a portion of the graph, showing the direction of the graph and also showing a bit of flexture.
The last x-intercept is at x = 7, with multiplicity 1. So I know that the graph passes through the axis at this point, and without any flattening or flexing. The graph went upward at the previous intercept, so I know it has to be coming back down for this intercept, so I've drawn a line segment passing directly downward through this point.
And, because this is an odd-degree and negative polynomial, I know that the graph will end its display by heading downward (forever), so (below) I've drawn a portion of a line heading toward the bottom right of the graphing area.
Note: If I multiplied out the variable factors of this polynomial (and there's no need to, so I'm not going to), the constant terms of these factors would give me:
5 × 5 × 1 × (−4) × (−4) × (−4) × (−7) = 11,200
Advertisement
This value is rather large. And this largeness explains the large denominator of the leading coefficient: by dividing the polynomial by a sufficiently-large number, they made this polynomial graphable. Otherwise, the graph would likely go waaaaaaay off my sheet of graph paper between the zeroes (or else my vertical scale would have to be crazy big). For instance, when x = 0, I'd be looking at trying to graph y = 11,200 if they hadn't included that leading fraction. That would make for one really tall graph, with anything "interesting" in the middle squished down into invisibility.
Affiliate
(Not all texts notice this size-of-graph issue, so don't worry about this consideration if it doesn't come up explicitly in class. When they want you to graph something, they'll remember the size issue, and they'll make the polynomial at least vaguely reasonable.)
Because the author of this exercise included that fraction in the polynomial, when I plug in x = 0, I get a nice simple y-value of:
(−1/5,600)(11,200) = −2
This is a reasonable value (and, being an intercept, is a point that I'm allowed to find and plot), so I will pencil in this intercept value on the graph, too:

I'm not supposed to find any other plot points (and I probably wouldn't want to try), so I'll just sketch in a rough guess as to what the graph looks like between my known points. I'll go further from the axis where there is more space between the zeroes, and I won't be so primitive as to assume that the y-intercept point is the minimum point of the graph between the zeroes on either side.
(Why? The midpoint between the two nearest zeroes, x = −1 and x = 4, is at x = 1.5. Based on the graphing I've done in the past, it makes sense to assume that the lowest point of the graph on this interval probably occurs closer to the middle of the interval, at x = 1.5, than off to the left at x = 0.)
By the way, the flexy intercept at x = 4 will probably push the curve of the graph a little over to the left, rather than leaving the minimum point roughly in the middle. However, the bump (or turning) on this interval is still more likely to be to the right of the y-axis, so I'll draw it that way.
Now that I've got my intercepts plotted, and I've got a graphing area with sketched indications of what happens at each zero, I can "rough in" an approximate drawing. Once I get that roughing-in looking nice and smooth, I'll then draw my final answer as a heavier line. I'll erase my preliminary sketch-marks before I hand in my solution. Here's the whole process:
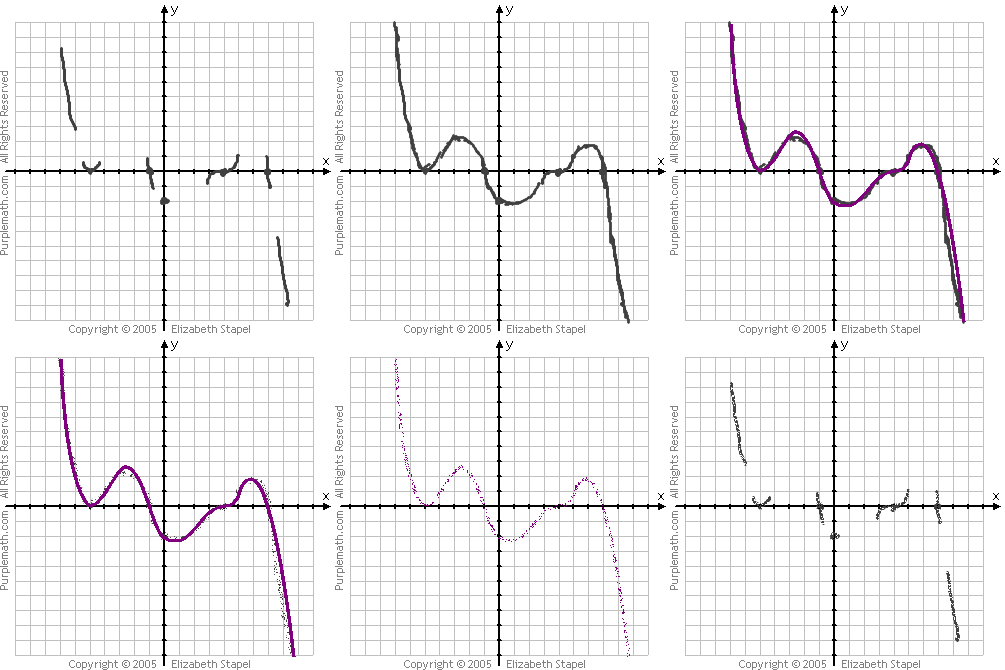
(The above graphic is animated on the "live" webpage.)
My hand-in would be the purple curve, so I'd turn in the following graph:

The above rough graph compares favorably with the actual graph of the polynomial:
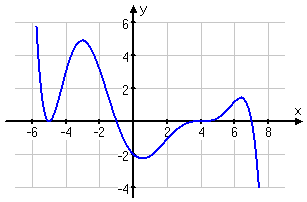
Yes, some of my details (like the specific coordinates of my max and min points) were a little bit off, but my overall sketch was still pretty good. If you take the time to practice, learning all of the steps along the way, and working neatly and carefully, you can end up doing graphs as good as this, too!
URL: https://www.purplemath.com/modules/polyends5.htm
Select a Course Below
Standardized Test Prep
Homeschool Math
© 2024 Purplemath, Inc. All right reserved. Web Design by ![]()


