Squeezing & Stretching
Purplemath
So far, we've added numbers to, and subtracted numbers from, functions and their arguments. That is, given a function f (x) and some number b, we have worked with f (x) + b, f (x) − b, f (x + b), and f (x − b).
Now we'll work with multiplication.
Content Continues Below
How can you compress or stretch a function?
In order to compress or stretch a function, either from top to bottom or from side to side, we multiply the function, or its argument, by some number. Multiplying the number on the whole function makes the graph taller (or shorter) but leaves the x-intercepts the same. Multiplying the number inside the function (that is, on the argument of the function) makes the graph wider (or more squeezed) but leaves the maximums and minimums the same.
How can you tell if the function has been stretched or compressed?
Affiliate
If the graph of the new function is taller or wider than the original function's graph, then the function has been stretched. If the graph of the new function is shorter or narrower than the original, then the function has been compressed.
(The terms "squeezed", "shortened", "compressed", "stretche", etc, seem not to have fixed meanings in this context, which makes this type of function transformation even more confusing. The more important thing is to understand the difference between multiplying outside the function and multiplying inside the function.)
What happens if you multiply a function by a number?
If you multiply a function by a number, then the function will get taller (if the number is greater than 1) or shorter (if the number is less than 1). But — and this is important — the x-intercepts will remain the same. This fixedness of the intercepts makes sense, since x-intercepts are where the function is zero, and zero times the number is still gonna be zero.
Using the function g(x) = (2 − x)(x + 1)(x + 4), the graphic below shows g(x) in blue, 2g(x) in dark green, and in dark red:
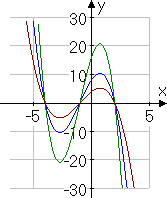
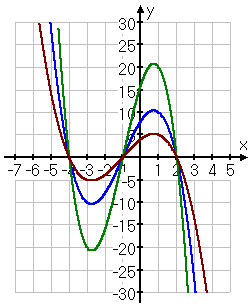
As you can see, multiplying on the outside of the function by 2 (which is larger than 1) caused the highs and lows of the original graph to go higher and lower. And multiplying by ½ (which is smaller than 1) caused the highs and lows of the original graph to contract, drawing closer to the x-axis. All of the x-intercepts are the same, and the max/min points line up vertically (that is, the max/min points occur at the same x values, but at different y-value heights).
This behavior — namely, that the x-intercepts don't move and the max/min points line up vertically — is the hallmark of multiplying a function on the outside by some number.
On the other hand, we can also multiply inside a function. In this case, I'll start with the same function g(x) = (2 − x)(x + 1)(x + 4). Instead of multiplying by 2 and by ½ on the outside, I'll instead multiply on the inside; that is, I'll multiply on the x that is the argument of the function.
For clarity, the two new functions are these:
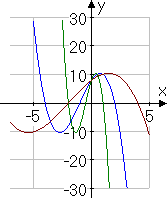
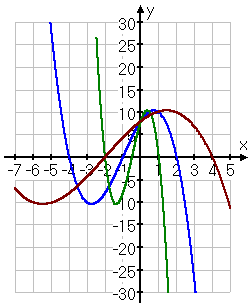
The graphic below shows g(x) in blue, g(2x) in dark green, and in dark red:
Affiliate
The effect of multiplying inside the function can be somewhat non-intuitive. As you can see, multiplying on the inside of the function by 2 (which is larger than 1) actually caused the graph to shrink inward from either side, toward the y-axis. And multiplying inside by ½ (which is smaller than 1) caused the graph to expand outward from the y-axis. All of the y-intercepts are the same, and the max/min points line up horizontally (that is, the max/min points occur at the same y-value heights, but at different x values).
This behavior — namely, at the y-intercepts don't move and the max/min points line up horizontally — is the hallmark of multiplying a function on the inside by some number.
However, it is generally quite difficult to tell exactly what a graph has been multiplied by, or whether the multiplication was inside or outside, just by looking at the picture. For instance, can you tell that the graph below shows 1.4 × f (x) = 1.4x2?
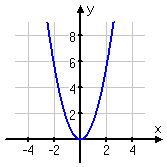
Not likely.
Affiliate
In my experience, it can feel just about impossible to discern whether a multiplication transformation involved multiplying inside or outside the function. Sometimes, though, it helps to look at the zeroes of the graph (if it has more than one) or turning points (that is, the max/min points).
How can you tell if a graph is stretched or compressed?
To figure out whether a graph is stretched or compressed, in comparison with the original graph, look at the max/min points and the x- and y-intercepts.
- Look at the intercepts. If the x-intercepts remain the same, then they multiplied outside of the function. If the y-intercepts remain the same, then they multiplied inside the function.
- Look at the max/min points. If these points line up vertically, then they multiplied outside of the function. If these points line up horizontally, then they multiplied inside the function.
- If they multiplied inside the function by something smaller than 1, or outside the function by something larger than 1, then they did a function stretch. if they multiplied inside the function by something larger than 1, or outside the function by something smaller than 1, then they did a function compression.
For instance, looking at y = x2 − 4, you can see that multiplying outside the function doesn't change the location of the zeroes, but multiplying inside the function does.
Here is the graph of the original function:
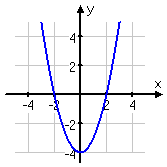
The x-intercepts are at x = −2 and x = +2, and the y-intercept (which is also the minimum point) is at y = −4.
Now let's look at the result of multiplying by 2 on the outside:
![graph of 2×f(x) = 2(x^2 − 4), showing x-intercepts at x = −2, 2, and y-intercept [cut off in the graph] at y = −8](fcns/trans40.gif)
In the graph above of 2y = 2(x2 − 4), you can see that the x-intercepts have remained the same, but the y-intercept has moved to twice the depth of the original y-intercept. (This graph's y-intercept is cut off in the graph, but is easily computed to be at y = −8, rather than the original y = −4.) The minimum point, being at the y-intercept in this case, has also moved further from the x-axis, but it is still lined up, vertically, with the original minimum point.
Now let's look at the result of multiplying by 2 on the inside:
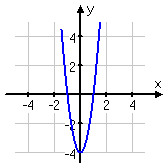
In the graph above of y(2) = ((2x)2 − 4), you can see that the x-intercepts have moved inward toward the y-axis to x = −1 and x = +1, but the y-intercept has remained the same as in the original graph.
Content Continues Below
To recap, the "left", "right", "up", "down", "flip", and "mirror" transformations are fairly straightforward, but the "multiply" transformations, also called "stretching" and "squeezing" (among other terms), can get a little messy. But if you pay close attention to the intercepts and the max/min points, you should be okay.
Typical homework problems on this topic ask you to graph the transformation of a function, given the original function; or else ask you to figure out the transformation, given the comparative graphs.
-
Thinking of the graph of f (x) = x4, graph the transformed function f (x − 2) + 1
The graph of f (x) = x4 looks like this:
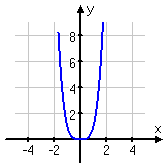
Looking at the expression for this translation, the "+1" outside the function tells me that the graph is going to be moved up by one unit. And the "−2" inside the argument tells me that the graph is going to be shifted two units to the RIGHT. (Remember that the left-right shifting is backwards from what you might expect.)
Generally, it's better to work from the inside out. So I'll first move the graph to the right by two units. Then I'll move the result up by one unit.
Then my translated graph looks like this:
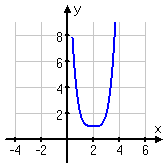
When they are having you graph by moving other graphs around, they can't be terribly critical of your drawing, since you aren't supposed to be doing a T-chart and computing the exact points. But do try to make your graph look sufficiently similar to the original graph; that is, draw a picture that can reasonably be accepted as being a transformation of the original function.
You can always cheat, by the way, especially if you have a graphing calculator, by quickly graphing the transformed function and verifying that it matches what you've drawn. But you do need to know how to do function transformations, because there are ways to ask the questions that don't allow you to cheat, as we'll see in the next section.
URL: https://www.purplemath.com/modules/fcntrans3.htm
Select a Course Below
Standardized Test Prep
Homeschool Math
© 2024 Purplemath, Inc. All right reserved. Web Design by ![]()


