Interquartile Ranges & Outliers
Purplemath
The interquartile range, abbreviated as IQR, is just the width of the box in the box-and-whisker plot. That is, IQR = Q3 − Q1.
The IQR can be used as a measure of how spread-out the values are.
Content Continues Below
What are outliers?
Outliers are data points which are regarded as being too far from the bulk of the data points to be valid. They are points way off to one end or the other, which are discarded as being "noise", a mismeasurement, or some other sort of error.
Why do we consider outliers at all?
Statistics assumes that your values are clustered around some central value. The IQR tells how spread out the middle (or the bulk of the) values are; it can also be used to tell when some of the other values are, in some sense, "too far" from the central value(s). These "too far away" points are called outliers, because they lie outside the range in which we expect them.
How do outliers relate to the Inter-Quartile Range?
The IQR is the length of the box in your box-and-whisker plot. An outlier is any value that lies more than one and a half times the length of the box from either end of the box.
That is, if a data point is below Q1 − 1.5×IQR or above Q3 + 1.5×IQR, it is viewed as being too far from the central values to be reasonable. Maybe you bumped the weigh-scale when you were making that one measurement, or maybe your lab partner is an idiot and you should never have let him touch any of the equipment. Who knows? But whatever their cause, the outliers are those points that don't seem to fit.
Why one-and-a-half times the width of the box for the outliers?
Why does that particular value demark the difference between acceptable and unacceptable values? Because, when John Tukey was inventing the box-and-whisker plot in 1977 to display these values, he picked 1.5×IQR as the demarkation line for outliers.
This has seemed to work well, so we've continued using that value ever since. If you go further into statistics, you'll find that this measure of reasonableness (for bell-curve-shaped data) means that usually only maybe as much as about one percent of the data will ever be outliers.
You can use the Mathway widget below to practice finding the Interquartile Range, also called "H-spread" (or skip the widget and continue with the lesson). Try the entered exercise, or type in your own exercise. Then click the button and scroll down to "Find the Interquartile Range (H-Spread)" to compare your answer to Mathway's.
Please accept "preferences" cookies in order to enable this widget.
(Click "Tap to view steps" to be taken directly to the Mathway site for a paid upgrade.)
Once you're comfortable finding the IQR, you can move on to locating the outliers, if any.
- Find the outliers, if any, for the following data set:
10.2, 14.1, 14.4. 14.4, 14.4, 14.5, 14.5, 14.6, 14.7, 14.7, 14.7, 14.9, 15.1, 15.9, 16.4
First, I check the list for ordering, and I find that these points are already listed in numerical order. So I can proceed with computations.
To find out if there are any outliers, I first have to find the IQR. There are fifteen data points, so the median will be at the eighth position:
(15 + 1) ÷ 2 = 8
Then Q2 = 14.6.
There are seven data points on either side of the median. The two halves are:
10.2, 14.1, 14.4. 14.4, 14.4, 14.5, 14.5
...and:
14.7, 14.7, 14.7, 14.9, 15.1, 15.9, 16.4
Q1 is the fourth value in the list, being the middle value of the first half of the list; and Q3 is the twelfth value, being th middle value of the second half of the list:
Q1 = 14.4
Q3 = 14.9
Then the IQR is given by:
IQR = 14.9 − 14.4 = 0.5
Outliers will be any points below the value:
Q1 − 1.5×IQR = 14.4 − 0.75 = 13.65
...or above the value:
Q3 + 1.5×IQR = 14.9 + 0.75 = 15.65
Then the outliers are the following data points:
10.2, 15.9, and 16.4
Content Continues Below
What are the fences?
The values for Q1 − 1.5×IQR and Q3 + 1.5×IQR are the "fences" that mark off the so-called reasonable values from the outlier values. Outliers lie outside the fences.
What are the inner and outer fences?
If your assignment is having you consider not only outliers but also "extreme" values;, then the values for Q1 − 1.5×IQR and Q3 + 1.5×IQR are the "inner" fences and the values for Q1 − 3×IQR and Q3 + 3×IQR are the "outer" fences.
The outliers (marked with asterisks or open dots) are between the inner and outer fences, and the extreme values (marked with whichever symbol you didn't use for the outliers) are outside the outer fences.
By the way, your book may refer to the value of " 1.5×IQR " as being a "step". Then the outliers will be the numbers that are between one and two steps from the hinges, and extreme value will be the numbers that are more than two steps from the hinges.
Looking again at the previous example, the outer fences would be at 14.4 − 3×0.5 = 12.9 and 14.9 + 3×0.5 = 16.4. Since 16.4 is right on the upper outer fence, this would be considered to be only an outlier, not an extreme value. But 10.2 is fully below the lower outer fence, so 10.2 would be an extreme value.
Affiliate
Affiliate
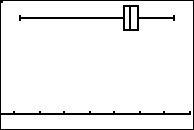
Your graphing calculator may or may not indicate whether a box-and-whisker plot includes outliers. For instance, the above problem includes the points 10.2, 15.9, and 16.4 as outliers. One setting on my graphing calculator gives the simple box-and-whisker plot which uses only the five-number summary, so the furthest outliers are shown as being the endpoints of the whiskers:

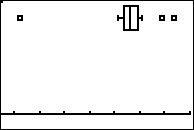
A different calculator setting gives the box-and-whisker plot with the outliers specially marked (in this case, with a simulation of an open dot), and the whiskers going only as far as the highest and lowest values that aren't outliers:

My calculator makes no distinction between outliers and extreme values. Yours may not, either. Check your owner's manual now, before the next test.
If you're using your graphing calculator to help with these plots, make sure you know which setting you're supposed to be using and what the results mean, or the calculator may give you a perfectly correct but "wrong" answer.
- Find the outliers and extreme values, if any, for the following data set, and draw the box-and-whisker plot. Mark any outliers with an asterisk and any extreme values with an open dot.
21, 23, 24, 25, 29, 33, 49
Advertisement
To find the outliers and extreme values, I first have to find the IQR. Since there are seven values in the list, the median is the fourth value, so:
Q2 = 25
The first half of the list is:
21, 23, 24
...so Q1 = 23; the second half is:
29, 33, 49
...so Q3 = 33. Then the IQR is given by:
IQR = 33 − 23 = 10
The outliers will be any values below:
23 − 1.5×10 = 23 − 15 = 8
...or above:
33 + 1.5×10 = 33 + 15 = 48
The extreme values will be those below:
23 − 3×10 = 23 − 30 = −7
...or above:
33 + 3×10 = 33 + 30 = 63
So I have an outlier at 49 but no extreme values. I won't have a top whisker on my plot because Q3 is also the highest non-outlier. So my plot looks like this:

It should be noted that the methods, terms, and rules outlined above are what I have taught and what I have most commonly seen taught. However, your course may have different specific rules, or your calculator may do computations slightly differently. You may need to be somewhat flexible in finding the answers specific to your curriculum.
URL: https://www.purplemath.com/modules/boxwhisk3.htm
Select a Course Below
Standardized Test Prep
Homeschool Math
© 2024 Purplemath, Inc. All right reserved. Web Design by ![]()


